Financial Plans and Performance
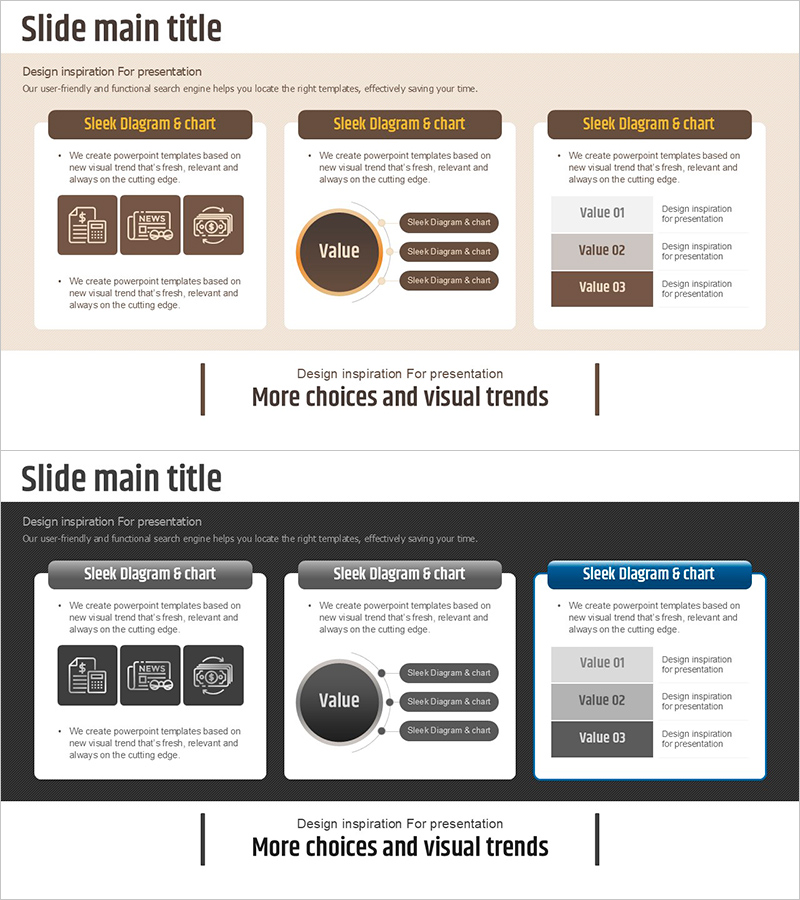
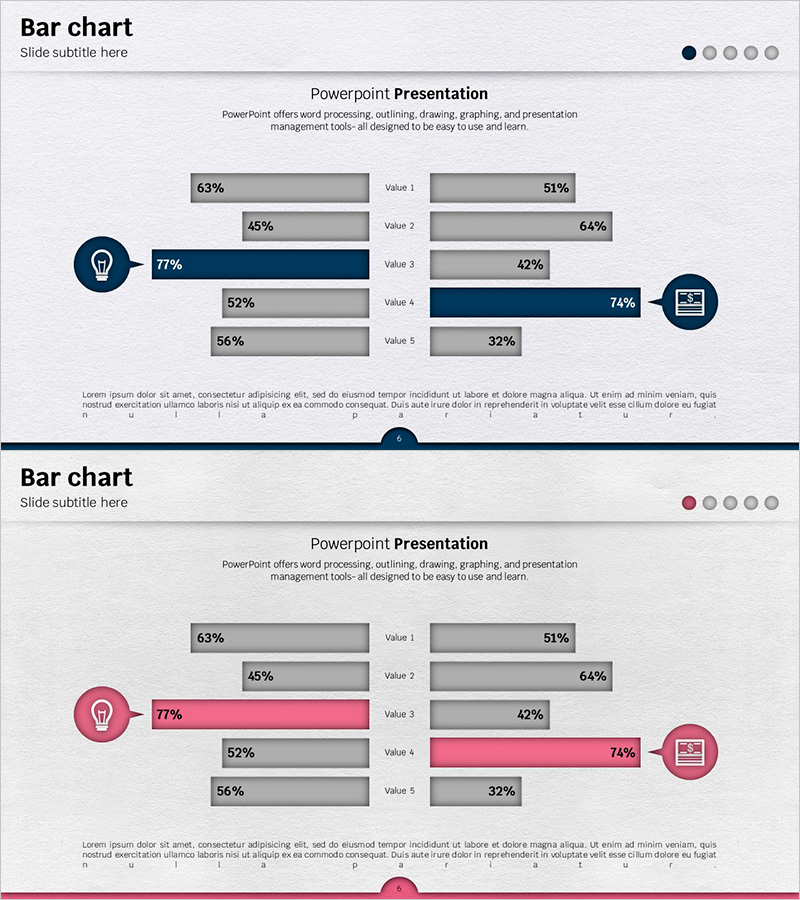
Required Fund Planning Chart – Visualizing Financial Performance
RJ0800020_15
- Last Update 12/21/2025
- File Size 0.2MB
- # of Slides 2
- File Format PPTX
- Slide Ratio 16:9
- Color
Keywords
About the Product
This slide is a diagram-based PowerPoint template that effectively visualizes required fund planning. With a simple and clear cluster format, it delivers understanding of fund flow. The combination of brown and gray adds credibility and stability, making it suitable for financial planning and tax strategy presentations. This slide can be effectively utilized in various business situations such as internal reports or business proposals. Changes in design are easy, with a 'moderate' editing difficulty, allowing for quick application to various content.
Related Products
-
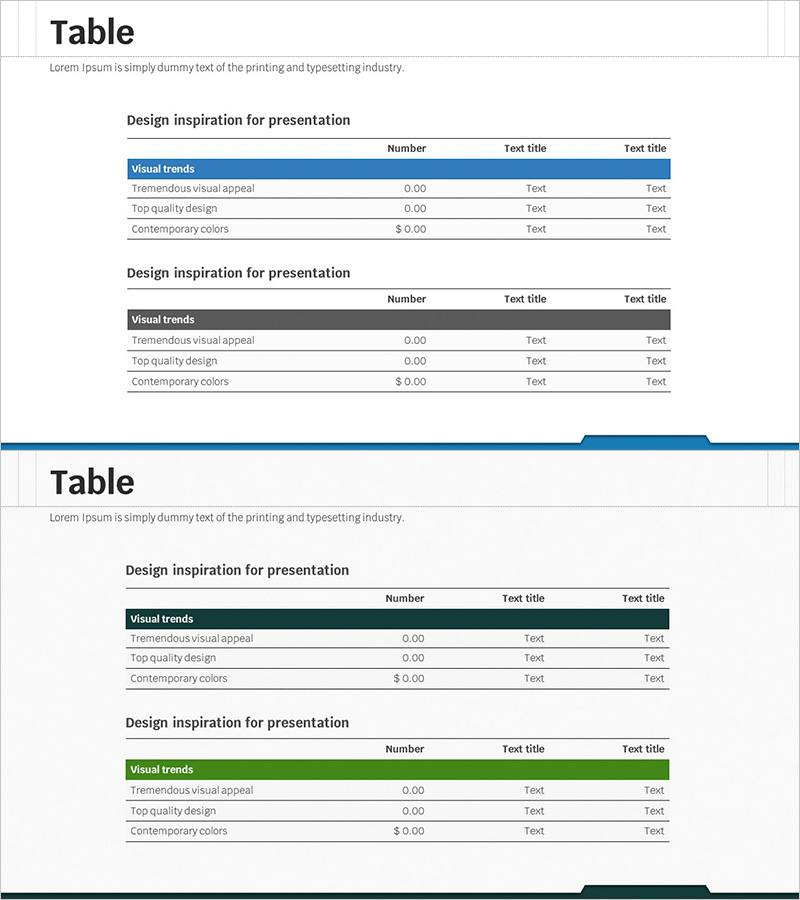
Key Financial Indicators Table – Clear Profit Analysis
#Financial Plans and Performance #Diagram #Income Statement
-
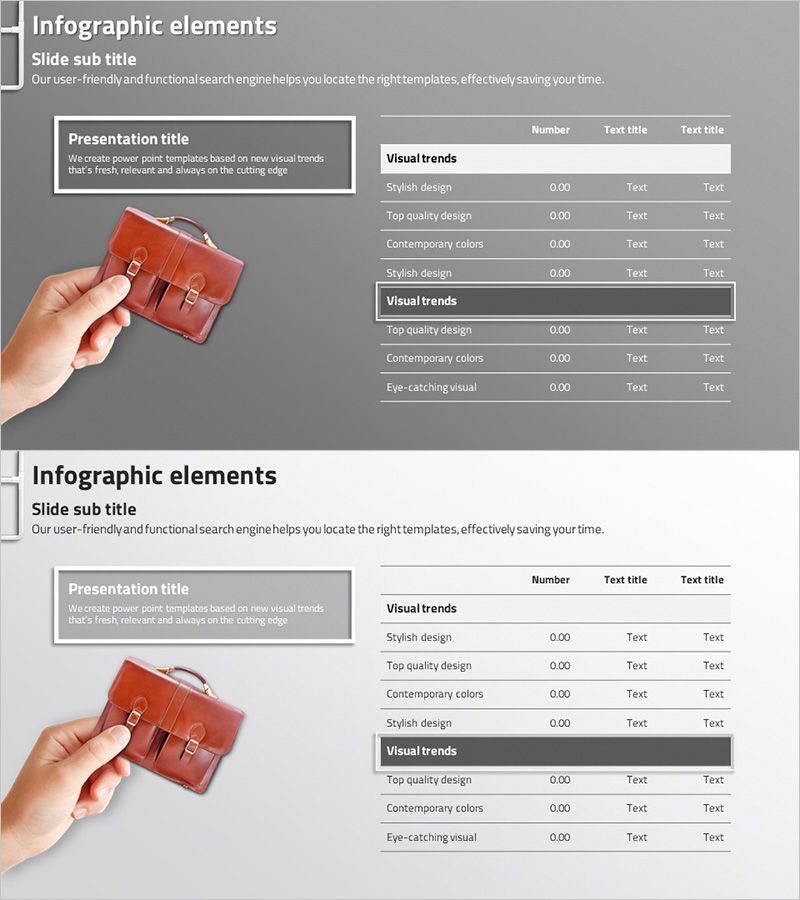
Business Income Statement – Visualizing Financial Performance
#Financial Plans and Performance #Diagram #Income Statement
-
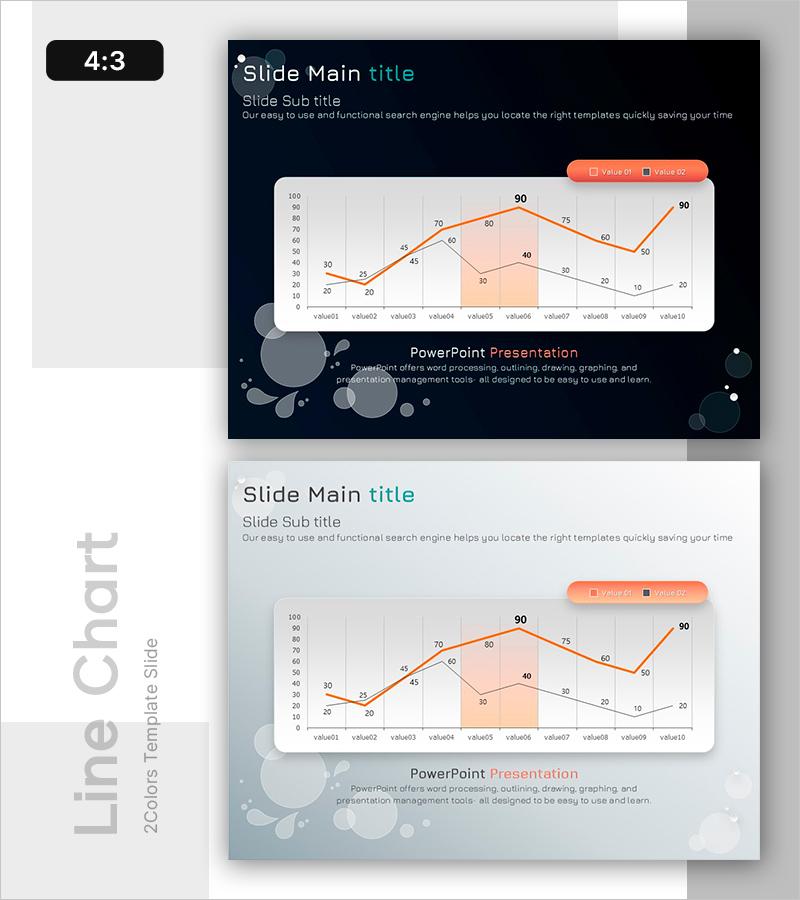
Market Trends with Key Focus Areas
#Market and Competitor Analysis #Financial Plans and Performance #Graph
-
Rainbow Presentation Template Bilateral Bar Graph – Market Status and Financial Analysis
#Market and Competitor Analysis #Financial Plans and Performance #Graph
