Market Trends with Key Focus Areas
RB0800061_12
- Last Update 03/27/2025
- File Size 0.2MB
- # of Slides 2
- File Format PPTX
- Slide Ratio 4:3
- Color
Keywords
- #Content-Based Slides
- #Design-Based Slides
- #Market and Competitor Analysis
- #Financial Plans and Performance
- #Graph
- #Future Outlook
- #Sales and Revenue
- #Line
- #Line Chart
- #4:3
- #line chart PowerPoint slide
- #dual-series trend analysis
- #market trends presentation
- #competitive analysis chart
- #financial performance graph
About the Product
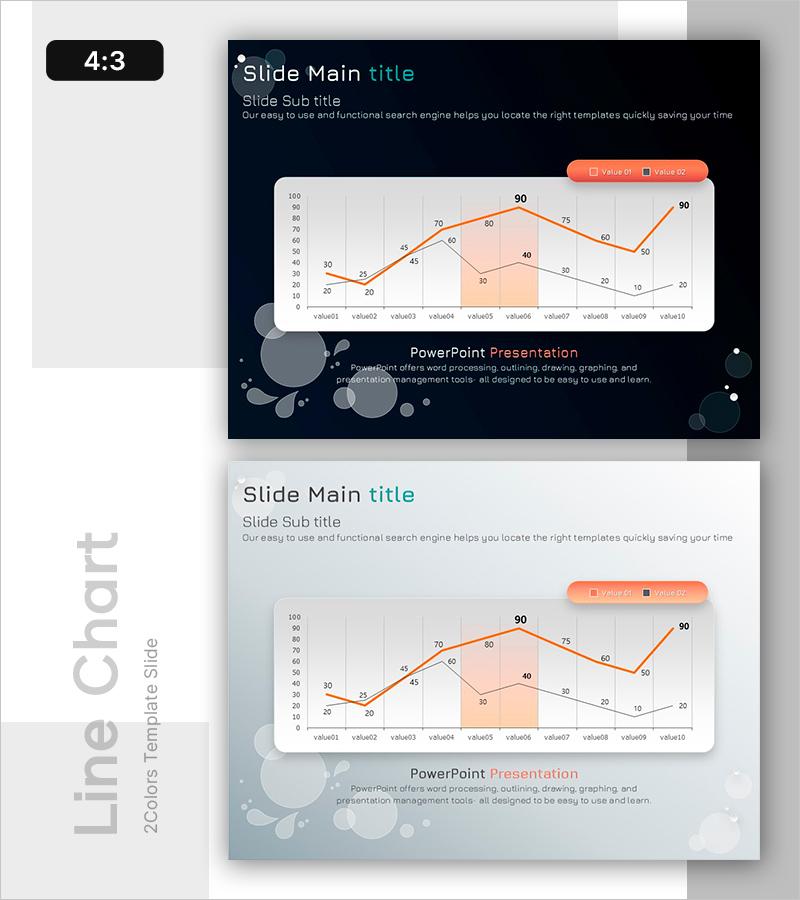
A dual-series line chart PowerPoint slide designed for market trends and competitive analysis presentations. Set against a dark navy background with orange accent highlighting, this slide visualizes 10 data points across two data series to clearly show change trajectories. Perfect for financial performance reports, market share evolution, competitive benchmarking, and quarterly business reviews. The 4:3 aspect ratio with 2-slide layout adapts seamlessly to various presentation environments and meeting room setups.
Usage Points
-
Main Usage
Compares numerical changes over time across two data series—ideal for market trends, financial KPIs, and competitive performance metrics. The 10 data points reveal both long-term trajectories and volatility, while the orange-and-gray two-tone accent clearly differentiates the two series for instant comprehension.
-
How to Use
Insert into executive reports, quarterly earnings presentations, and market analysis decks within the data analysis section. Replace legend labels (Value 01, Value 02) with actual metric names and input your data values—the chart updates automatically. The background circular graphic elements provide visual stability and professional polish.
-
Recommended For
Finance, marketing, and strategy teams presenting quarterly reports, investor briefings, and competitive landscape analyses. Especially effective when comparing two departments, product lines, or geographic regions, or when displaying actual-versus-target performance trends.
-
Slide Structure
2-slide set. Slide 1: Dark navy background with orange-and-gray dual-series line chart (10 data points, Y-axis 0–100 scale). Slide 2: Light gray background with identical chart structure for bright-tone alternative. Title, subtitle, and legend areas are fully editable.
Related Products
-

Line Graph Visualizing Future Market Outlook for Sailing Travel
#Market and Competitor Analysis #Financial Plans and Performance #Graph
-

Real Estate Upside Down Chart – Visualizing Market Trends
#Market and Competitor Analysis #Financial Plans and Performance #Graph
-

Comparison Graph by Transportation Industry – Market Analysis and Financial Performance
#Market and Competitor Analysis #Financial Plans and Performance #Graph
-

Rising Curve Graph for Sales Growth – Looking Ahead
#Market and Competitor Analysis #Financial Plans and Performance #Graph
