Market and Competitor Analysis
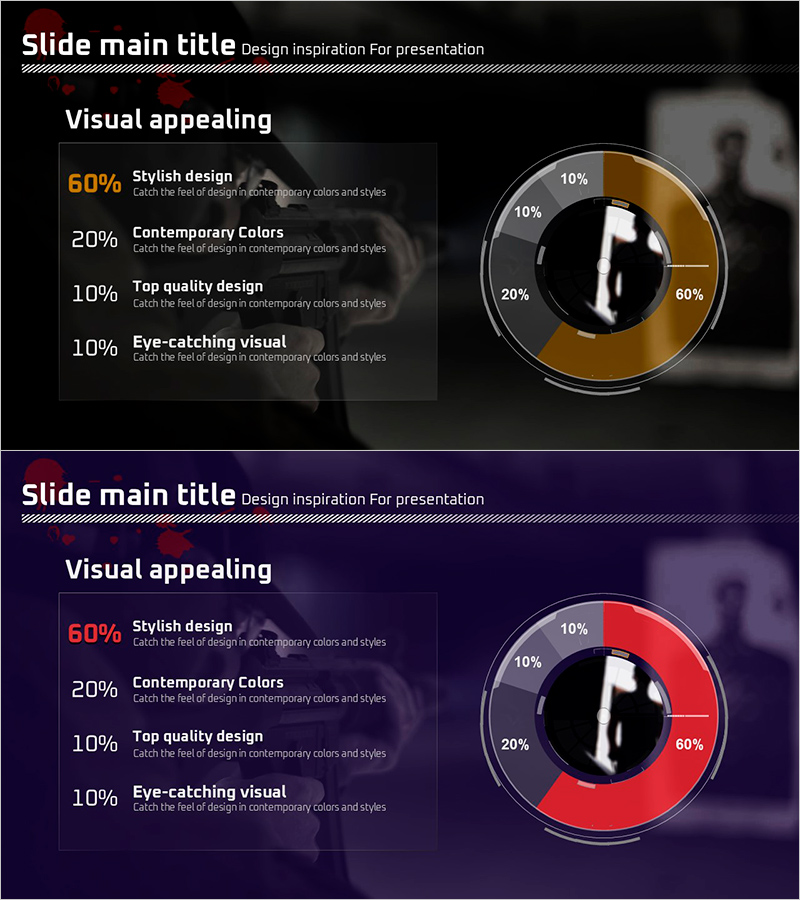
Analysis of Crime Occurrence Locations – Data Visualization
RJ0800010_6
- Last Update 12/21/2025
- File Size 0.8MB
- # of Slides 2
- File Format PPTX
- Slide Ratio 16:9
- Color
Keywords
About the Product
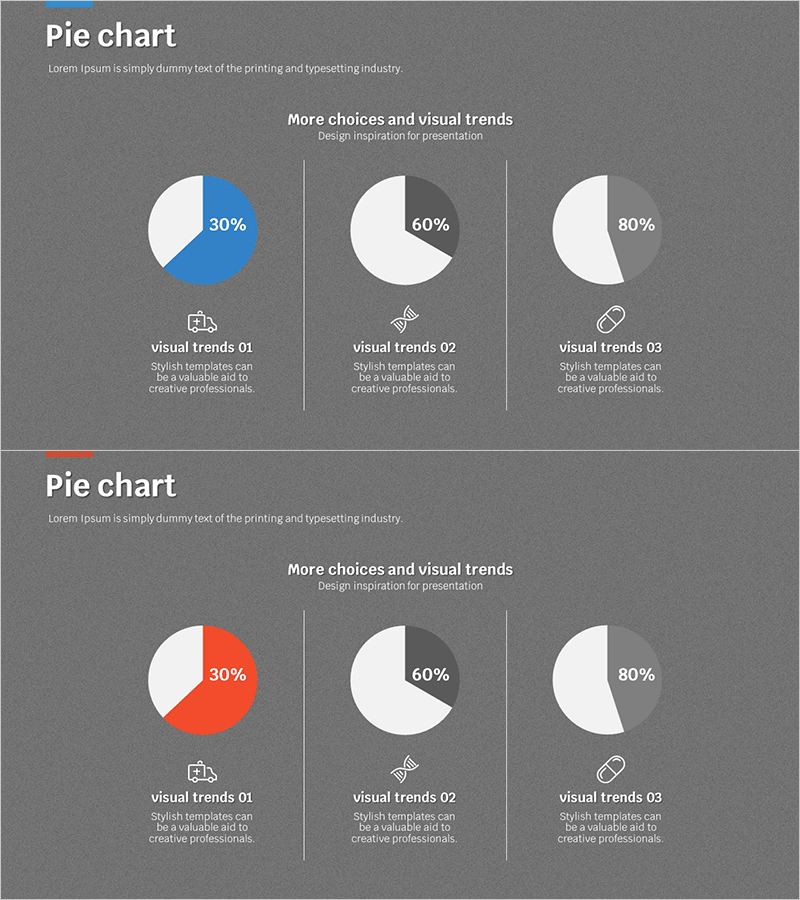
This slide employs a doughnut chart to effectively analyze and visualize data related to crime occurrence locations. With 60% stylish design, it features a modern color palette that captures the audience's attention. This slide is designed to convey specific information regarding market share analysis and crime statistics, making it particularly suitable for crime reports and analyses. The primary colors of brown and red express urgency and alertness. Text and graph elements are easy to replace, with an overall editing difficulty rated as 'easy'.
Related Products
-
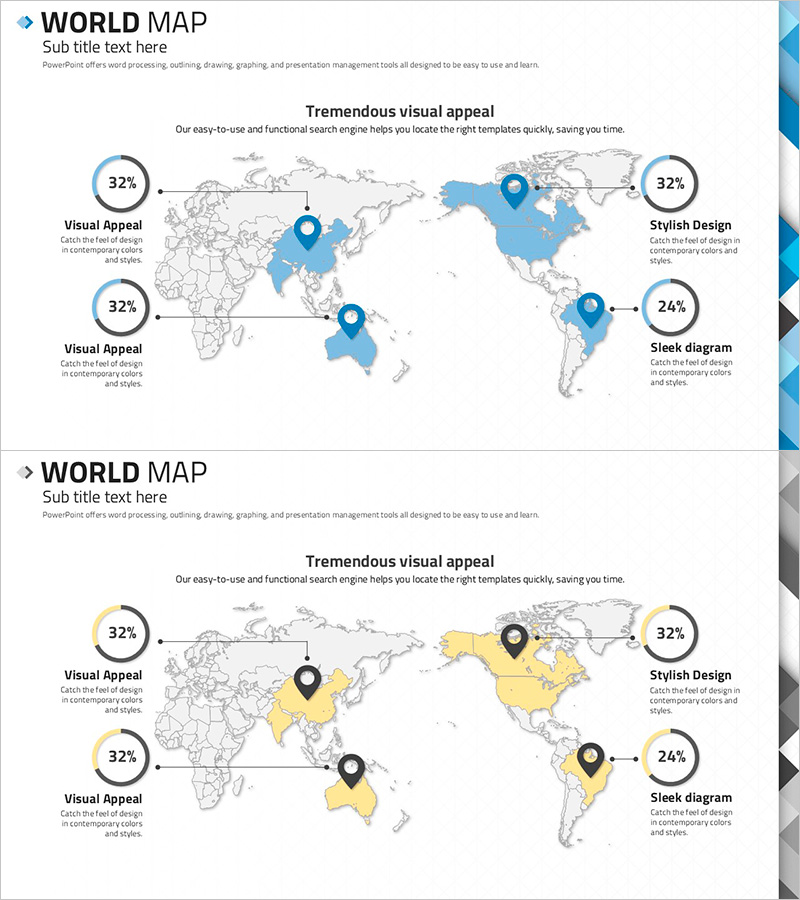
Abstract Pattern World Map Template – Harmony of Design and Data
#Market and Competitor Analysis #Financial Plans and Performance #Graph
-
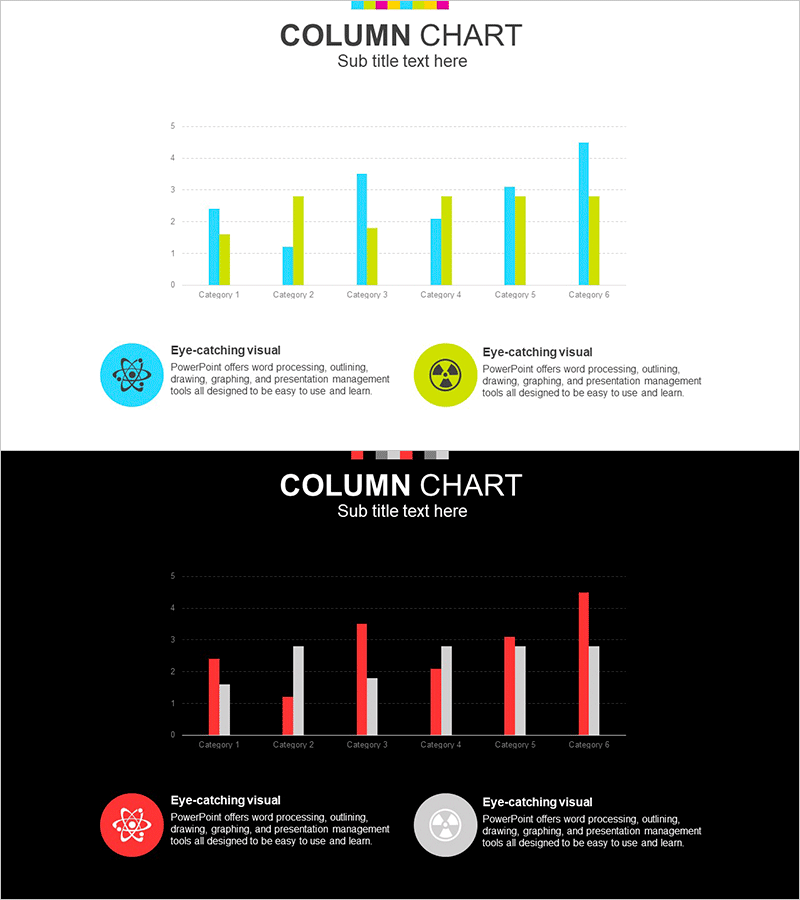
Chemical Experiment Vertical Bar Graph - Data Visualization and Analysis
#Market and Competitor Analysis #Graph #Competitor Analysis
-
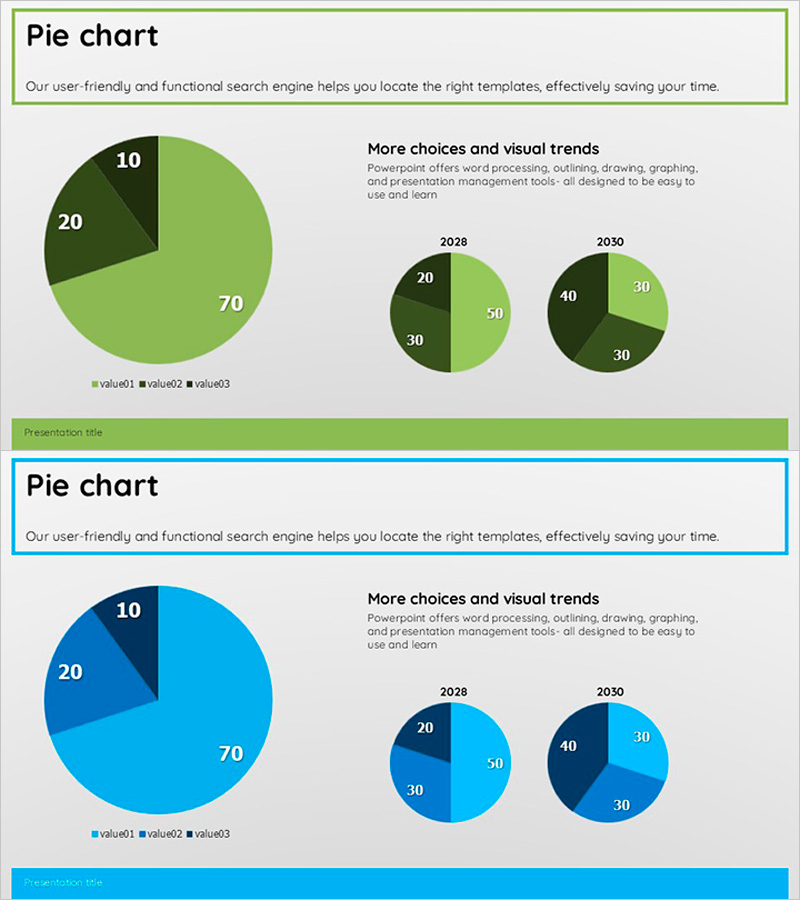
Market Share Analysis with 3 Simple Pie Charts
#Market and Competitor Analysis #Graph #Market Share
-
Medical Analysis Pie Chart – Visualization of Market Trends
#Product/Service #Market and Competitor Analysis #Graph
