Business Promotion Strategy
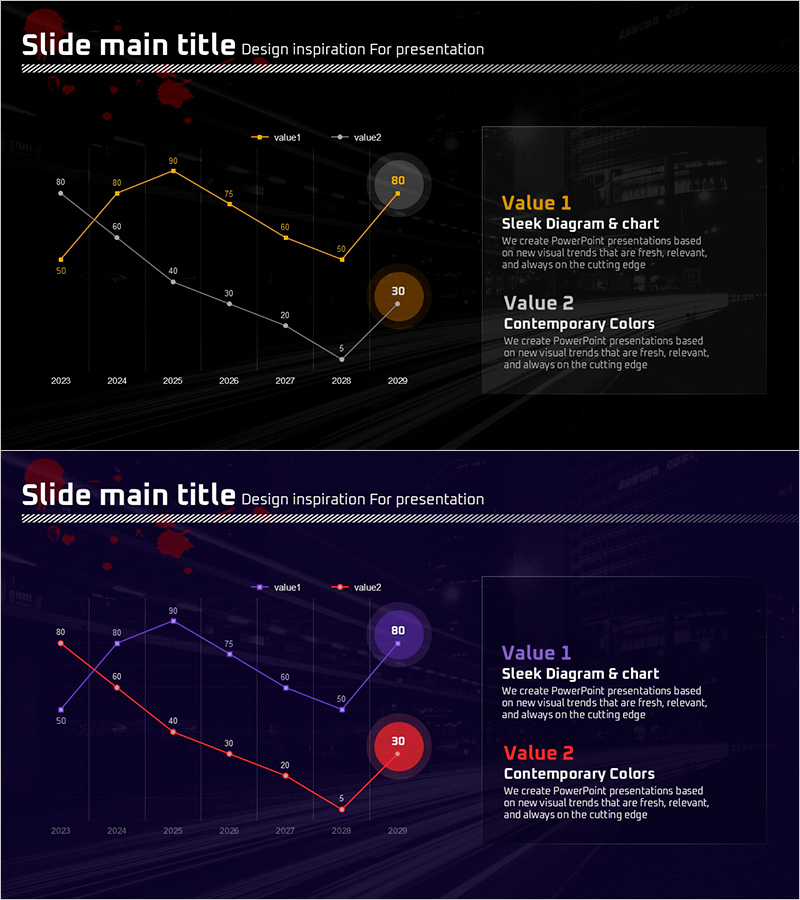
Trend in the Number of Crimes – Visual Data Analysis
RJ0800010_13
- Last Update 12/21/2025
- File Size 1MB
- # of Slides 2
- File Format PPTX
- Slide Ratio 16:9
- Color
Keywords
About the Product
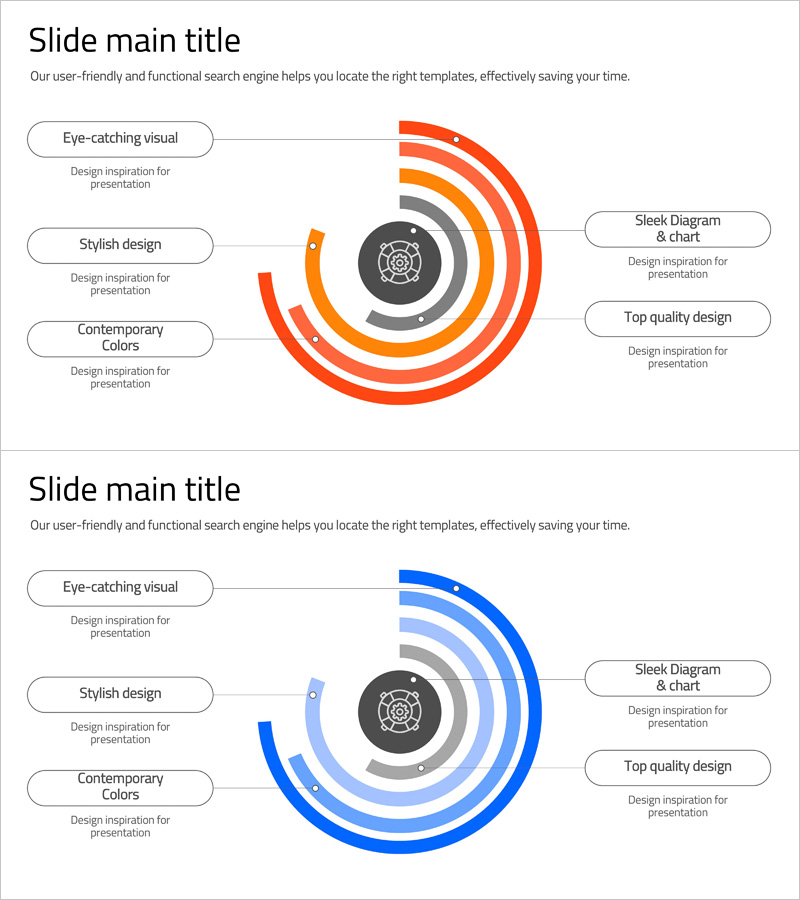
This slide provides a visual graph of crime rates in a clear and intuitive manner. The use of contrasting colors—yellow, purple, and red—against a dark background enhances the visual impact. This slide is suitable for market and competitive analysis reports, policy proposals, and other business documents, supporting data-driven decision-making processes. It features easily editable text and graph elements, with an overall editing difficulty rated as 'easy', making it adaptable to various presentations quickly.
Related Products
-
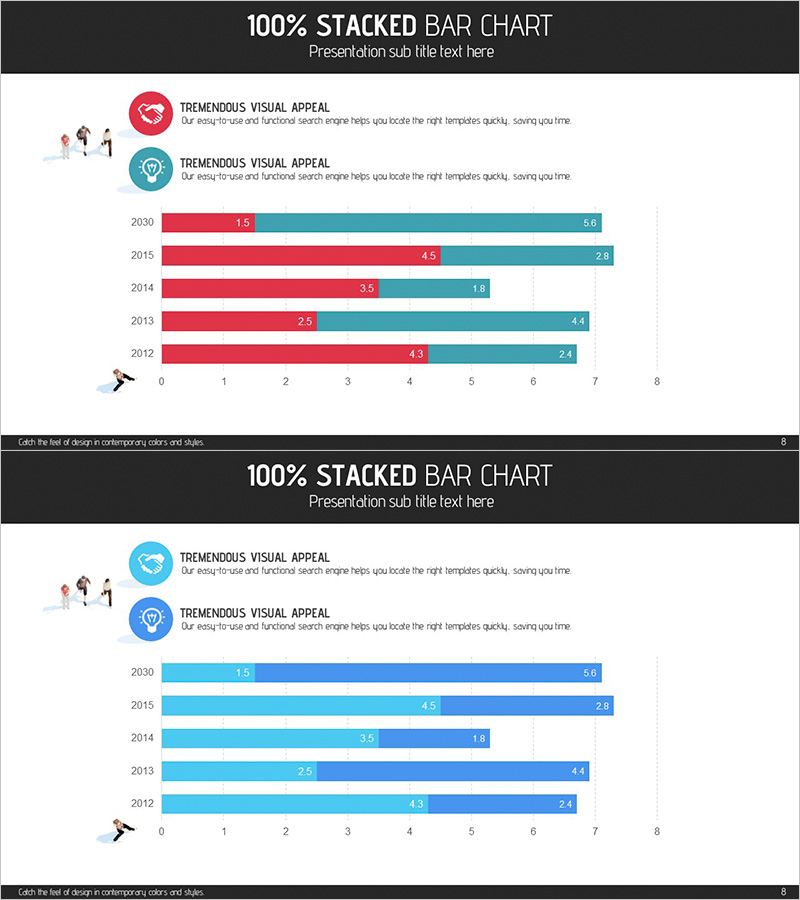
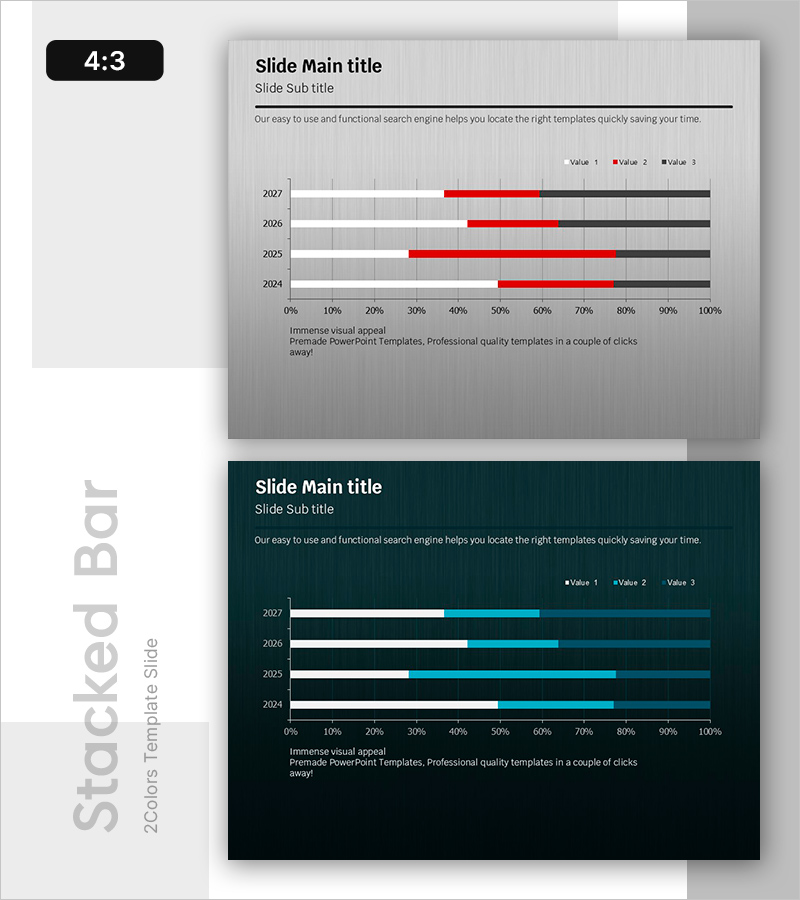
Market Analysis with Horizontal Stacked Bar Graph – Visualizing Competitive Advantage
#Market and Competitor Analysis #Graph #Competitor Analysis
-
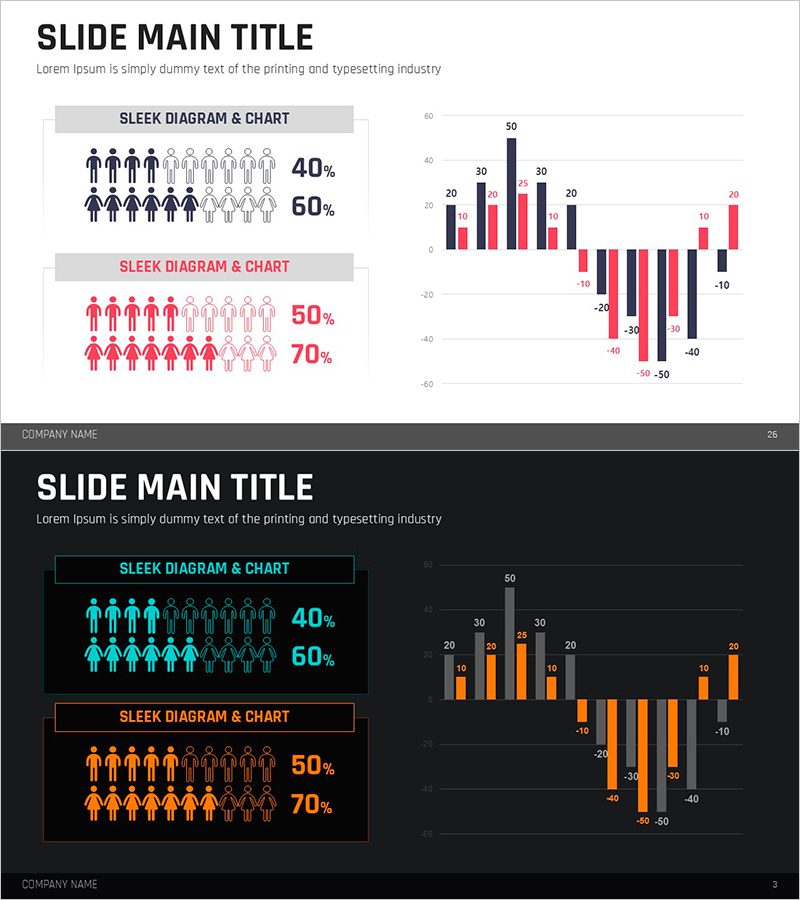
Gender Analysis Chart – Ideal for Market & Customer Analysis
#Market and Competitor Analysis #Financial Plans and Performance #Graph
-
Bar Chart of Key Segments – Data Analysis and Performance Visualization
#Business Introduction #Graph #Horizontal Bar
-
Competitive Advantage Analysis Diagram – Drive to Market Success
#Product/Service #Market and Competitor Analysis #Diagram
