Market and Competitor Analysis
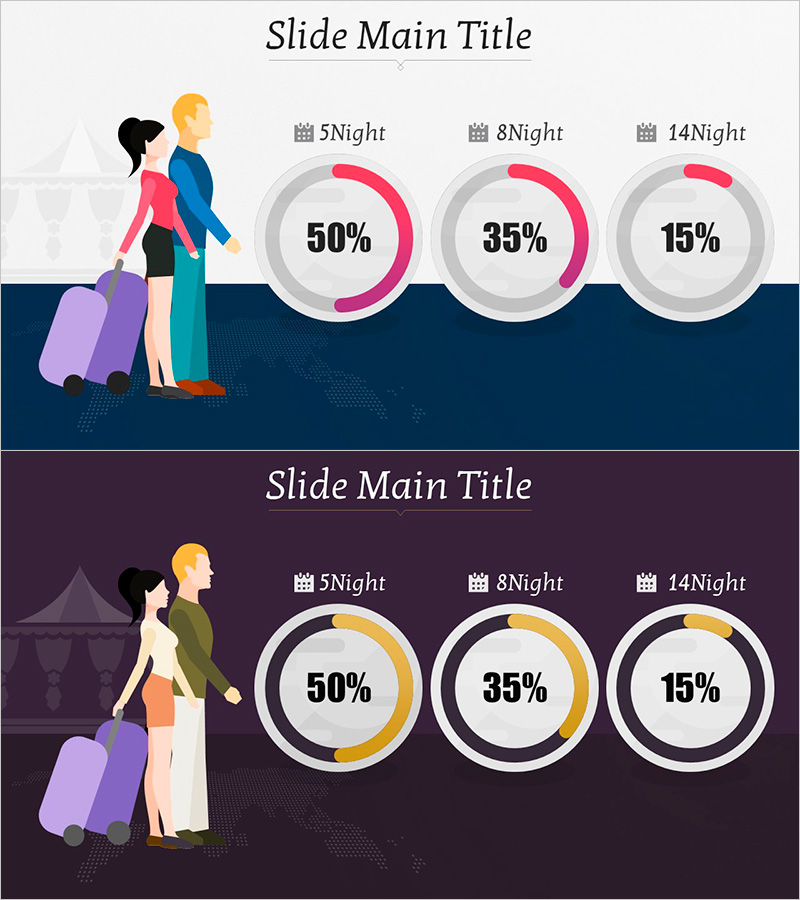
Donut Chart Slide for Honeymoon Planning – Visualizing Travel Plans
RJ0800009_24
- Last Update 12/21/2025
- File Size 1.6MB
- # of Slides 2
- File Format PPTX
- Slide Ratio 16:9
- Color
Keywords
About the Product
This slide presents a donut chart visually depicting travel plans based on honeymoon durations. Each segment illustrates the proportions of 5-night, 8-night, and 14-night stays, facilitating intuitive understanding for users. The main colors - red and purple - emphasize love and romance, making the design eye-catching. Ideal for presentations related to honeymoon planning or travel product showcases, this slide can be effectively employed in travel-related proposals. Text and graph areas are easily editable, rated as 'easy', allowing for quick integration into various presentations.
Related Products
-
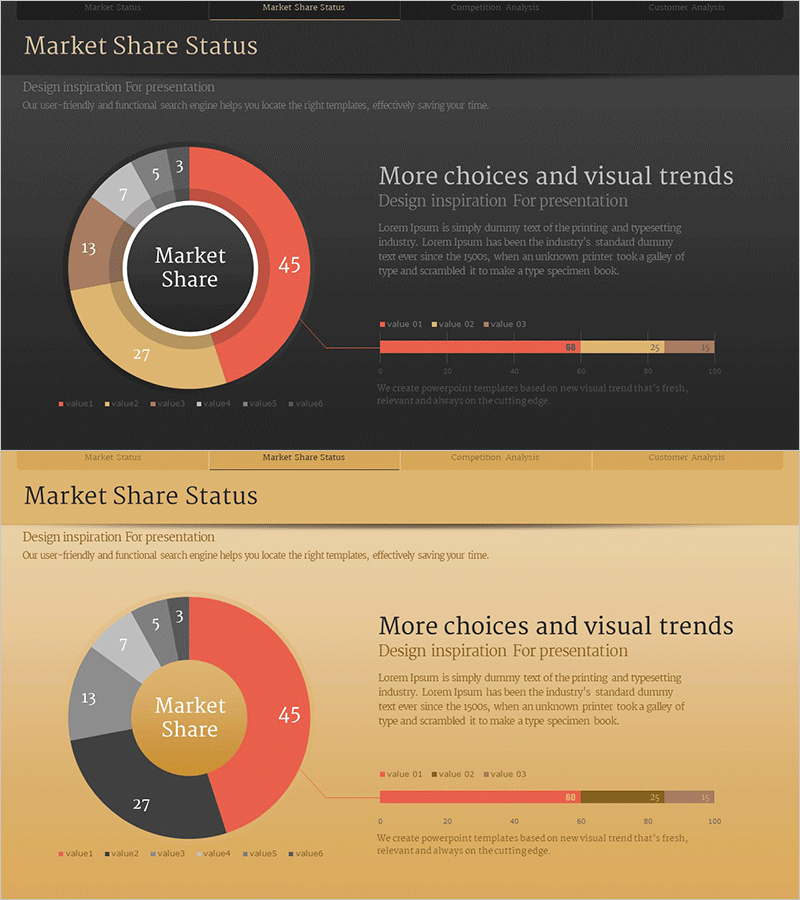
Donut-shaped Key Market Analysis Graph – Visualizing Market Share
#Product/Service #Market and Competitor Analysis #Graph
-
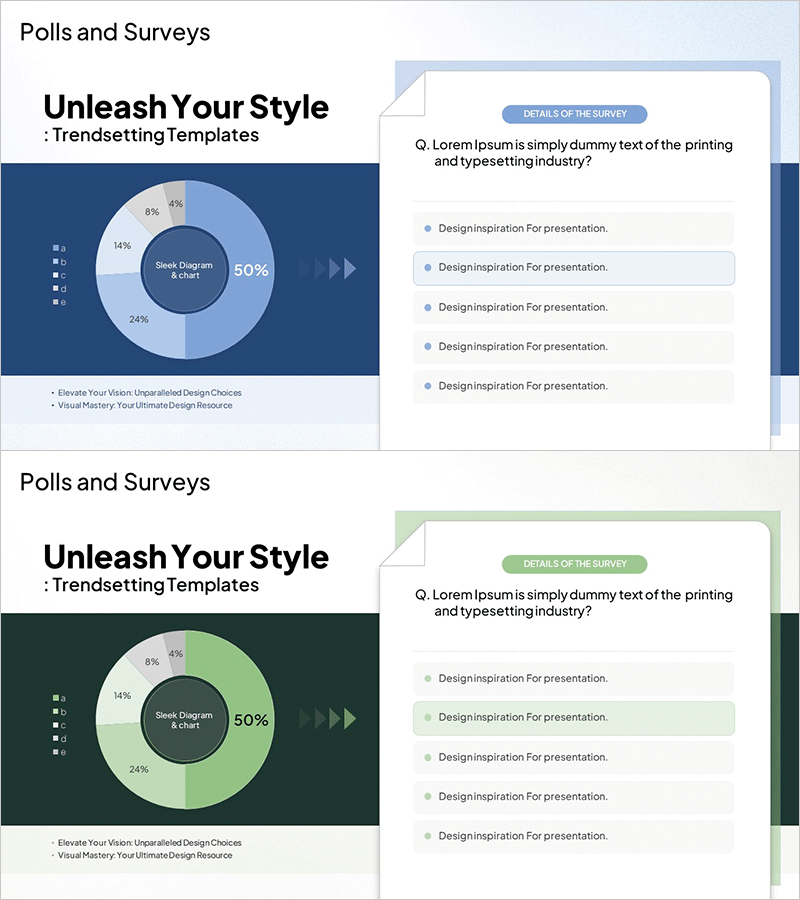
Survey and Poll Analysis Graphs – Optimized for Market Analysis
#Market and Competitor Analysis #Diagram #Graph
-
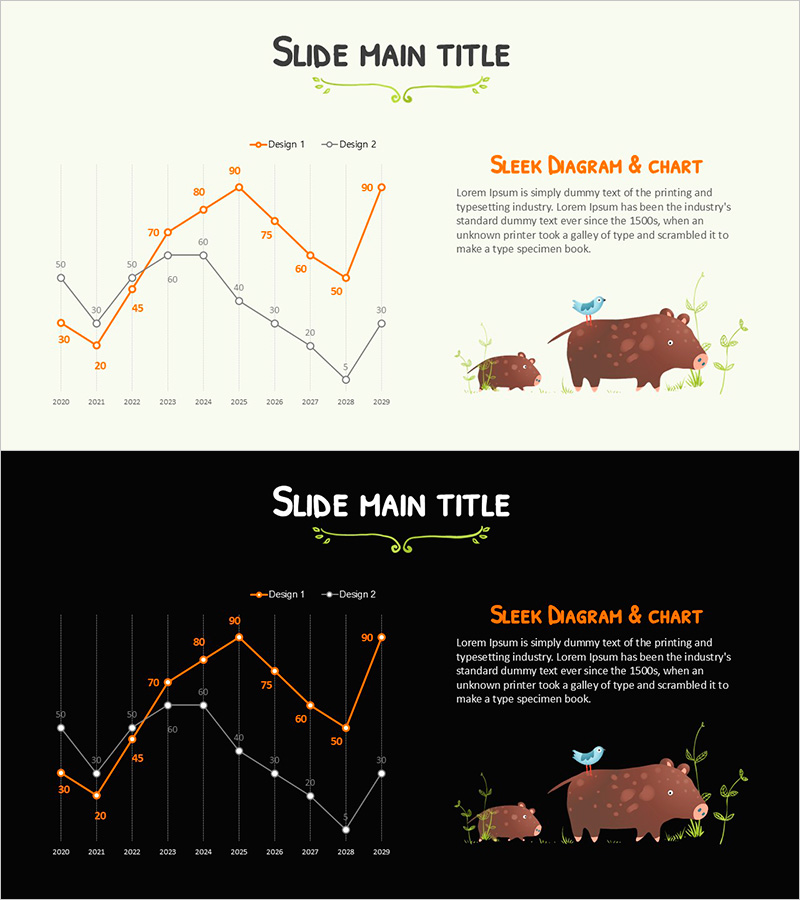
Pig Family and Market Analysis Graph Slide
#Market and Competitor Analysis #Graph #Market Analysis
-
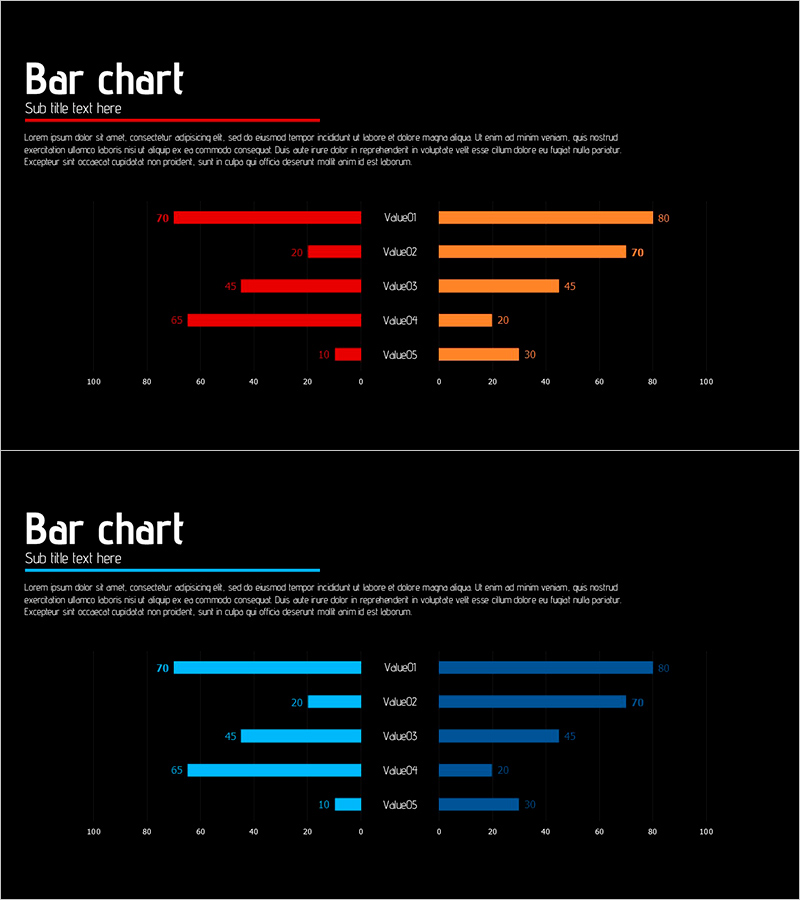
Red Blue Double Bar Graph – Data Visualization
#Graph
