Segmented Gradient Bar Graph – Optimized for Market Analysis
RJ0700016_21
- Last Update 07/26/2025
- File Size 0.4MB
- # of Slides 2
- File Format PPTX
- Slide Ratio 16:9
- Color
Keywords
About the Product
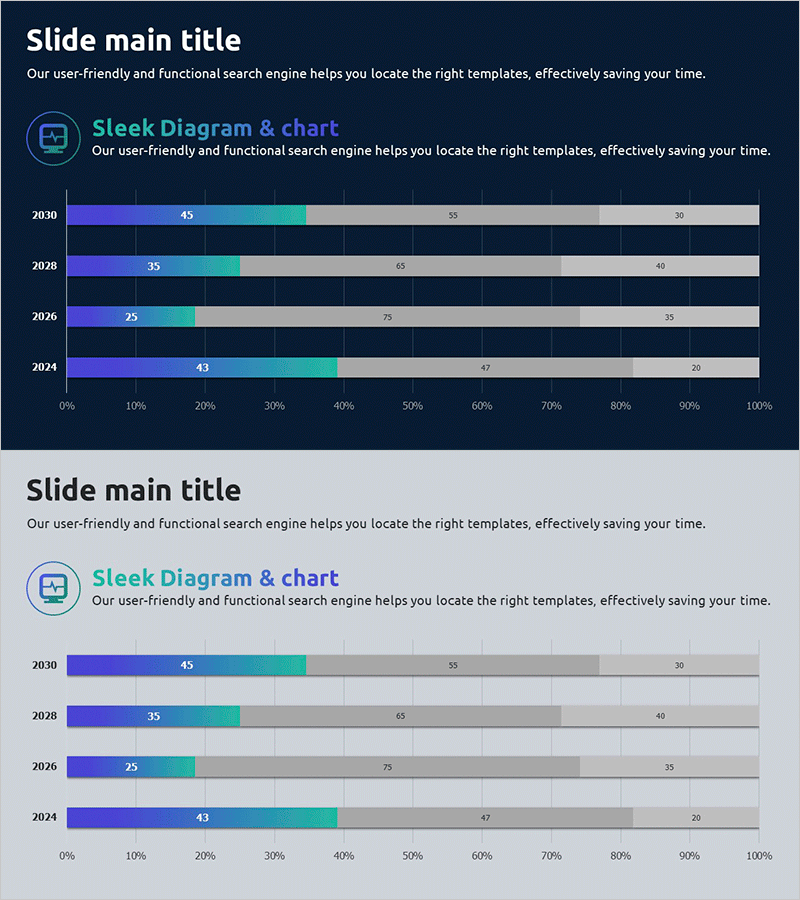
A 4-series segmented gradient bar chart PowerPoint slide designed for comparative data visualization. The dark navy background features blue, teal, and gray gradient bars representing year-over-year data from 2024 to 2030 across four distinct categories. This horizontal bar chart template is optimized for market sizing, competitive analysis, sales trends, and customer satisfaction metrics. The 16:9 widescreen format includes 2 slides ready for immediate use in business presentations, reports, and strategic planning documents.
Usage Points
-
Main Usage
Compare multiple data series across years and categories using a segmented horizontal bar chart. Visualize market size trends, competitor market share, product category revenue, customer segment satisfaction, and other multi-dimensional business metrics simultaneously across four data series.
-
How to Use
Insert into business reports, marketing plans, and investor presentations within market analysis or competitive landscape sections. The bar lengths and color gradients intuitively communicate data magnitude and category differences, while the 0–100% horizontal scale enables ratio-based comparisons across all segments.
-
Recommended For
Marketing managers, business strategists, financial analysts, and executives presenting market conditions, competitive positioning, and sales performance. Ideal for consulting firms, financial institutions, and manufacturing companies delivering strategic planning presentations and quarterly business reviews.
-
Slide Structure
2-slide set featuring 4-series horizontal bar charts with gradient fills (blue, teal, gray, light gray) representing data from 2024, 2026, 2028, and 2030. Each slide includes a 0–100% horizontal axis scale with data labels. Dark navy background with white typography ensures high contrast and readability in both digital and printed formats.
Related Products
-

Target Country Analysis Chart – Data Visualization for Market Analysis
#Market and Competitor Analysis #Graph #Other
-

Target Market Analysis Data Table - Market Growth Statistics
#Market and Competitor Analysis #Graph #Other
-

Business Area Analysis Graph & PC Mockup
#Technical Approach #Market and Competitor Analysis #Graph
-

Soccer Match Analysis Chart – Performance Analysis and Future Forecast
#Business Vision and Strategy #Market and Competitor Analysis #Graph
