Business Introduction
Visualizing Research and Development Progress – Technical Insights
RJ0700012_15
- Last Update 12/21/2025
- File Size 0.3MB
- # of Slides 2
- File Format PPTX
- Slide Ratio 16:9
- Color
Keywords
About the Product
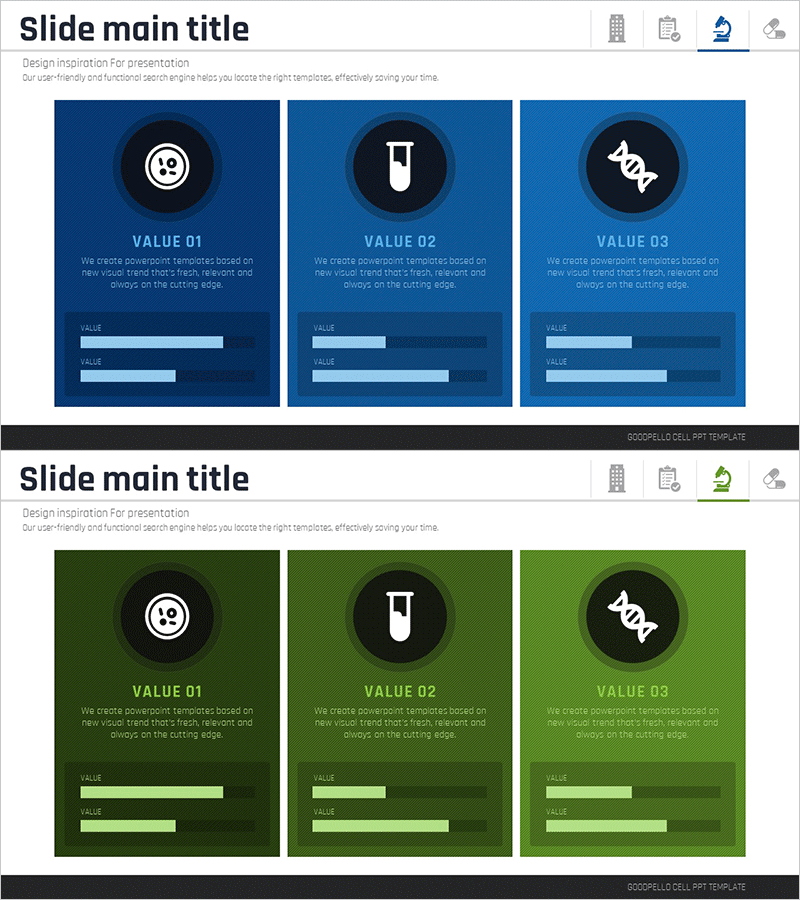
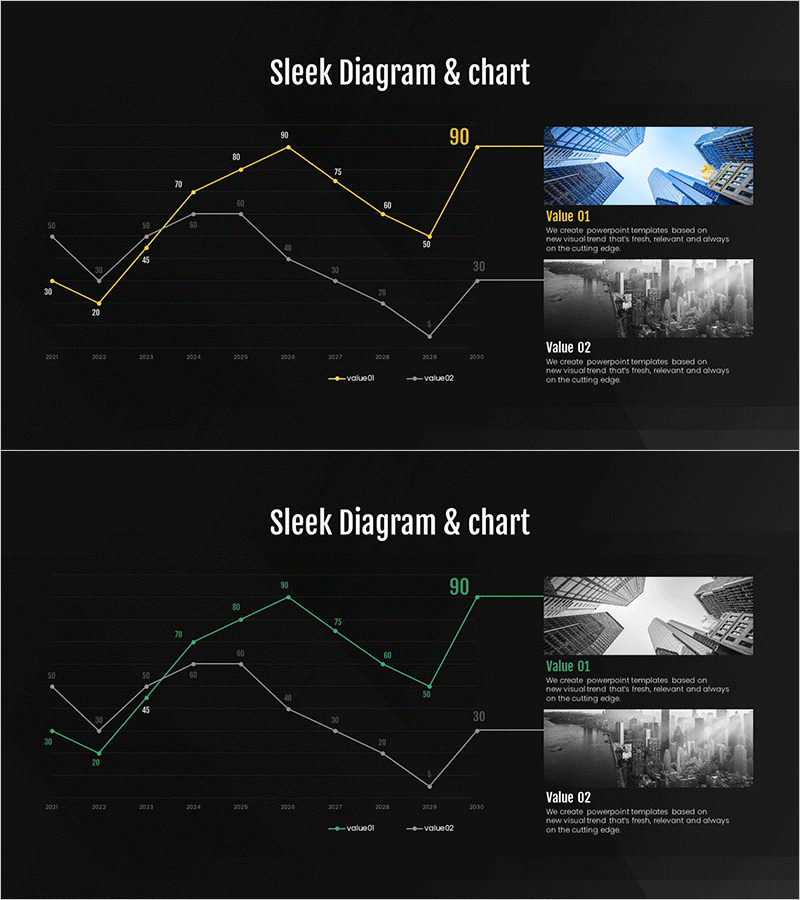
This slide provides a diagram that visually represents the progress of research and development. By utilizing a horizontal bar design, it clearly conveys the progress and presents the correlations of related technologies and data through a cluster structure. This slide is suitable for business introductions and technology status reports, providing not only data delivery but also a strong impression for the audience. The primary audience includes internal staff and investors, aiming to provide clear information and insights. The editing difficulty is rated as 'moderate', allowing for easy replacement of text and data, enhancing its usability.
Related Products
-
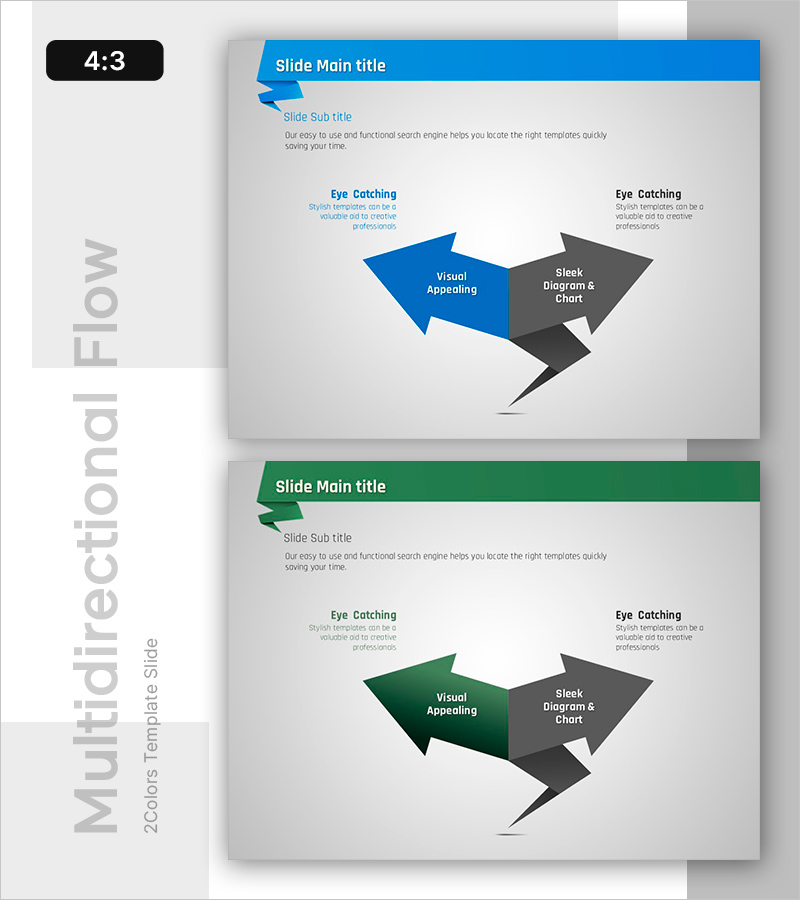
Multi-Directional Flow Diagram for Information Visualization – Slides for Creative Professionals
#Diagram #Flow #Multidirectional Flow
-
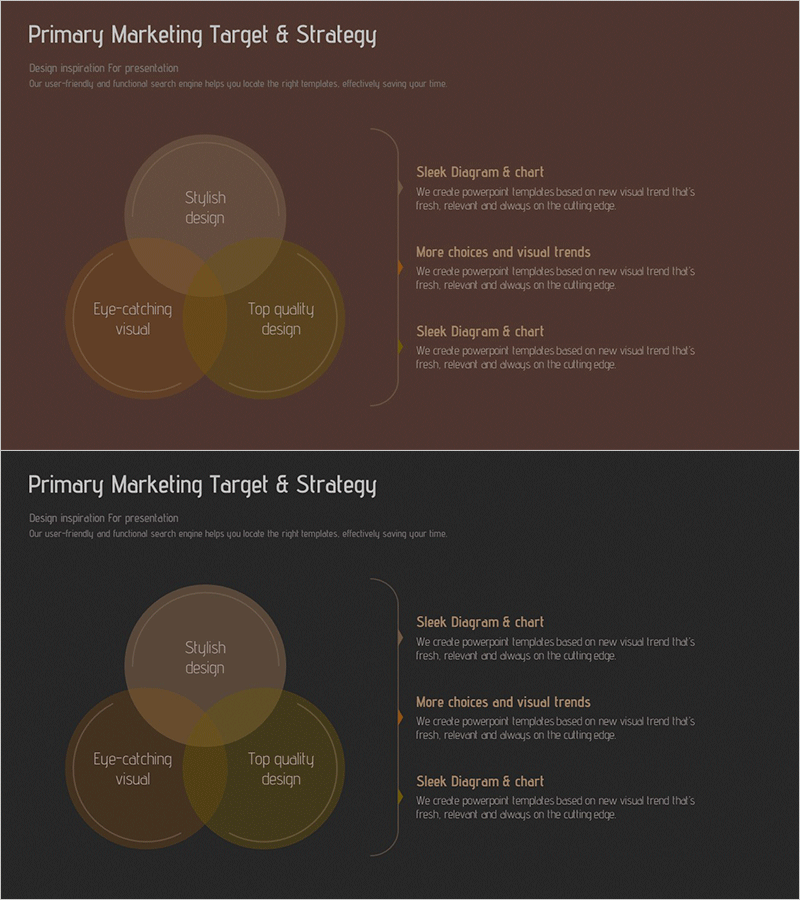
Marketing Target Strategy Overlay Diagram
#Marketing Plan and Strategy #Diagram #Marketing Strategy
-
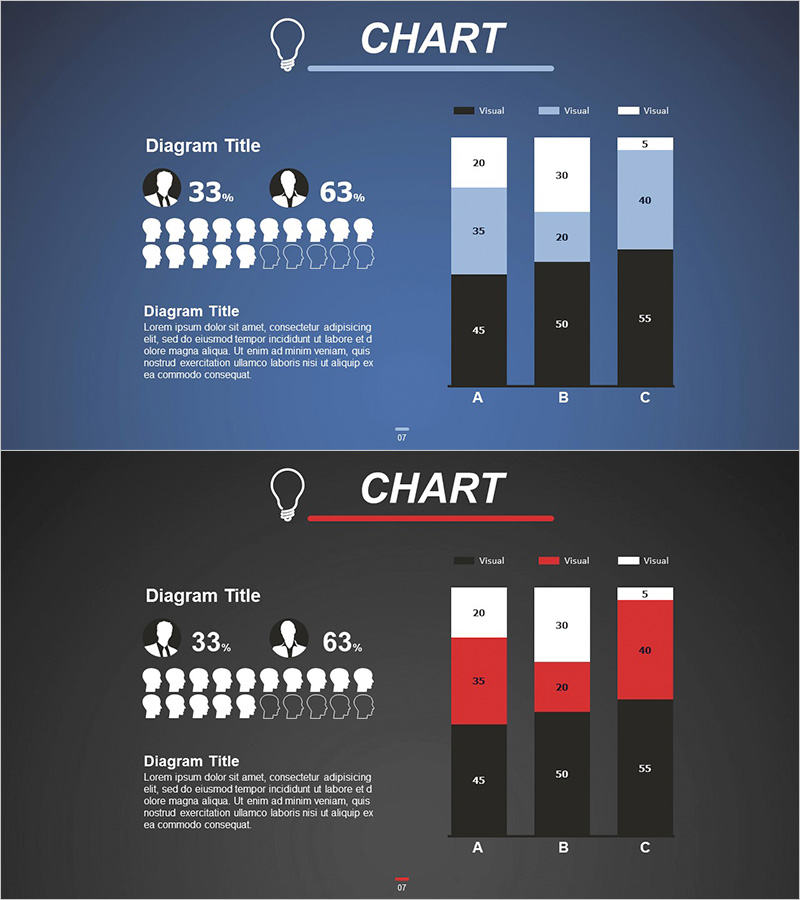
Customer Analysis Diagram & Segmentation Graph – In-depth Market Insights
#Market and Competitor Analysis #Graph #Customer Analysis
-
Future Outlook Broken Line Graph – Business Strategy and Marketing Plan
#Business Vision and Strategy #Marketing Plan and Strategy #Graph
