Future Outlook Broken Line Graph – Business Strategy and Marketing Plan
RJ0300094_13
- Last Update 05/15/2025
- File Size 1MB
- # of Slides 2
- File Format PPTX
- Slide Ratio 16:9
- Color
Keywords
- #Content-Based Slides
- #Design-Based Slides
- #Business Vision and Strategy
- #Marketing Plan and Strategy
- #Graph
- #Business Strategy
- #Marketing Strategy
- #Line
- #Line Chart
- #16:9
- #line chart PowerPoint slide
- #trend analysis presentation
- #dual-series graph
- #business strategy slide
- #marketing performance chart
About the Product
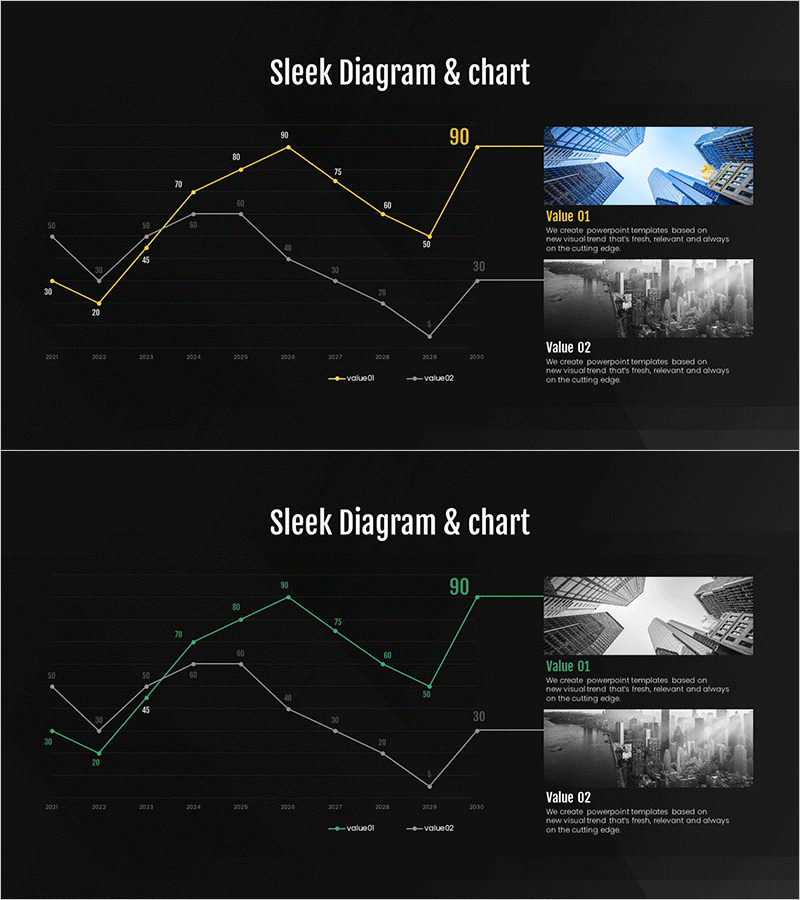
A professional dual-series line chart PowerPoint slide designed to visualize business strategy and marketing performance trends. The slide features two data series rendered in gold and white lines against a dark background, tracking changes from 2022 to 2030 with precise numerical labels at each data point. The right side includes Value 01 and Value 02 sections for inserting supporting images or explanatory text. This 16:9 format, 2-slide set is ready for immediate use in executive presentations, quarterly reviews, and strategic planning sessions.
Usage Points
-
Main Usage
Effectively communicate year-over-year performance changes, revenue trends, market growth rates, and customer satisfaction metrics by comparing two key indicators over time. Ideal for business performance reports, marketing effectiveness analysis, financial results presentations, and strategic reviews.
-
How to Use
Replace the X-axis (years) and Y-axis (values) with your actual data. Update the line colors and data points to match your dataset. Add relevant images or descriptive text in the Value 01 and Value 02 sections to provide context and enhance the narrative.
-
Recommended For
Executive reports, quarterly and annual performance reviews, marketing ROI analysis, investor presentations, strategy meetings, and board-level communications. Particularly suited for finance, consulting, marketing, and sales teams presenting data-driven insights.
-
Slide Structure
2-slide set. Each slide contains a dual-series line graph spanning 2022–2030 with approximately 9 data points per series, labeled with precise values. The right panel provides dedicated space for Value 01 and Value 02 images and text. Gold and white lines intersect to emphasize trend variations.
Related Products
-

Smart Network Business Strategy Diagram – Business Vision and Marketing Strategy
#Business Vision and Strategy #Marketing Plan and Strategy #Diagram
-

Gear Diagram & Table – Business Strategy and Marketing Plan
#Business Vision and Strategy #Marketing Plan and Strategy #Diagram
-

Visualizing Successful Business Meeting Strategies with Diagram Slide
#Business Vision and Strategy #Marketing Plan and Strategy #Diagram
-

Big Data Business Strategy Connection Diagram
#Business Vision and Strategy #Marketing Plan and Strategy #Diagram
