Market and Competitor Analysis
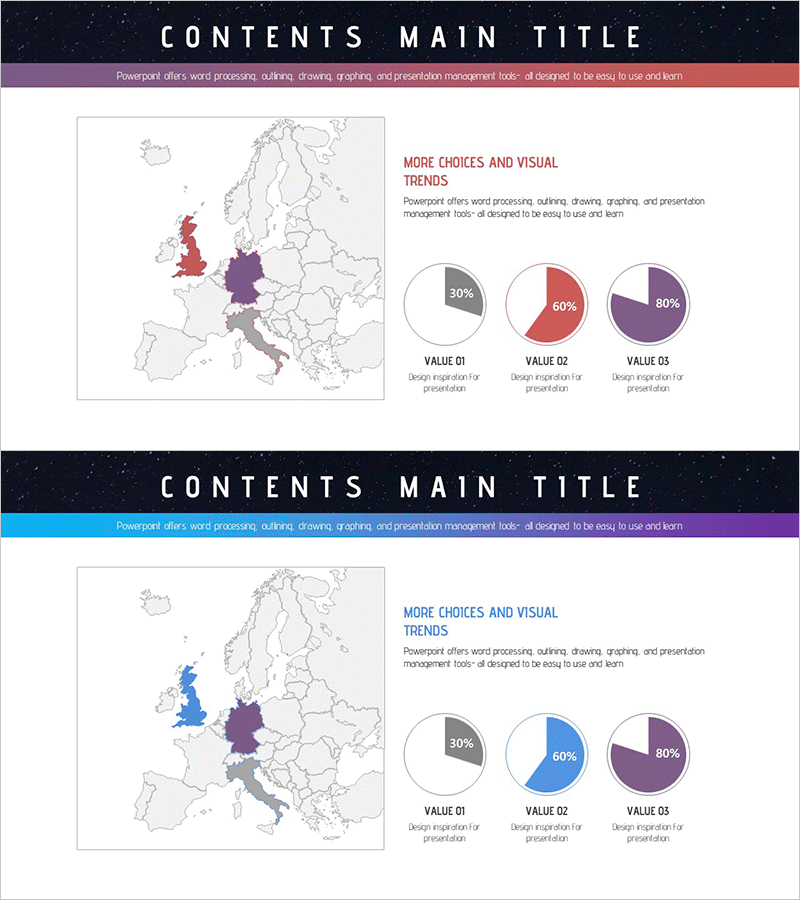
European Target Market Share Graph – The Power of Market Analysis
RJ0700006_24
- Last Update 12/21/2025
- File Size 2.3MB
- # of Slides 2
- File Format PPTX
- Slide Ratio 16:9
- Color
Keywords
About the Product
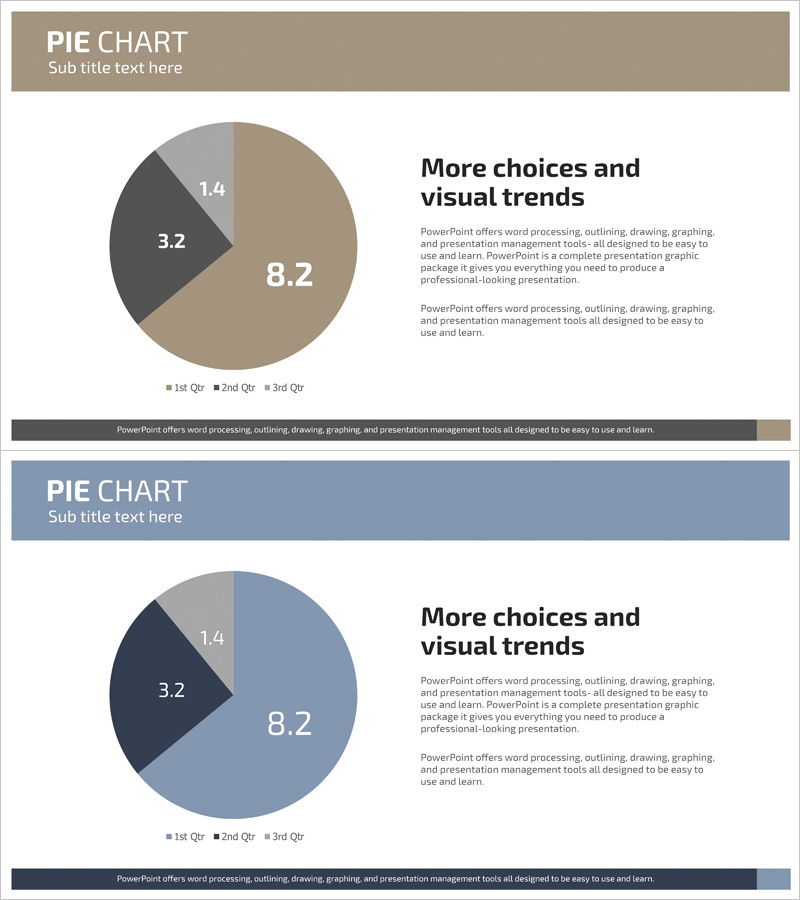
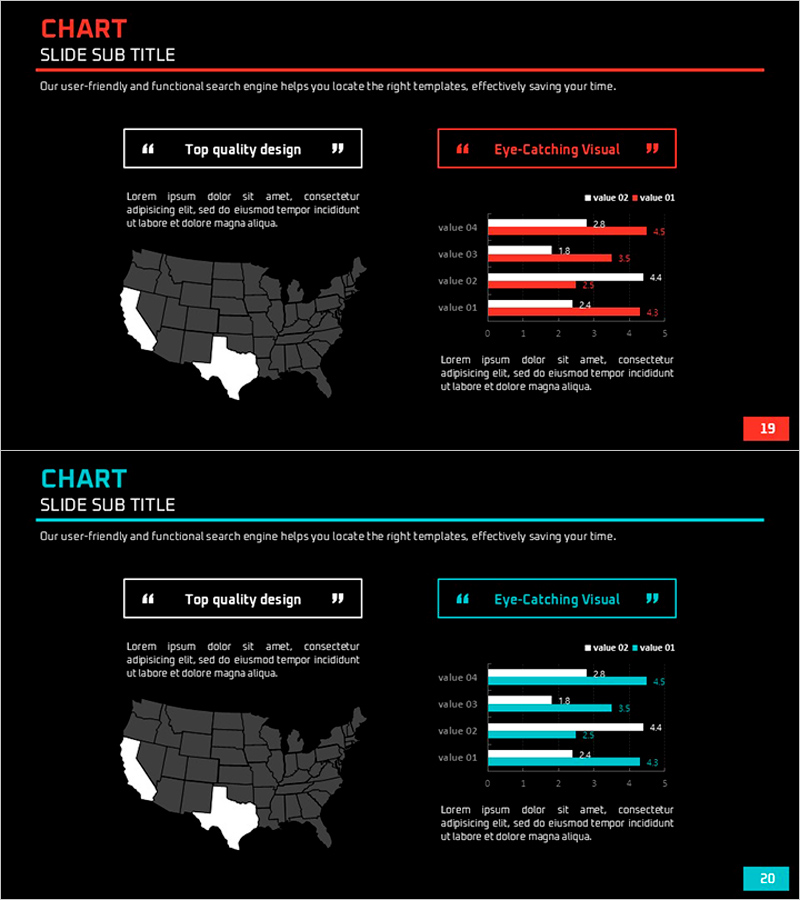
This slide presents a pie chart that clearly visualizes the market share for the European region. The strong contrast of red, blue, and black captures visual interest, making it easy to convey the share of each area at a glance. It is particularly useful for business presentations focused on market analysis, ideal for effectively delivering succinct data. The visual flow begins from the central regional graphic and seamlessly transitions to the share chart, with an overall editing difficulty rated as 'easy', making it adaptable for various presentation materials.
Related Products
-
Data Market Analysis Circle Chart – Insightful Visuals
#Product/Service #Market and Competitor Analysis #Graph
-
Highlight Graph and Analytical Text – Emphasizing Results and Competitive Advantage
#Company Introduction #Market and Competitor Analysis #Graph
-
Comparative Analysis Line Graph – Market & Competitor Analysis
#Market and Competitor Analysis #Graph #Competitor Analysis
-
Regional Demand Comparison Graph
#Market and Competitor Analysis #Graph #Other
