Market and Competitor Analysis
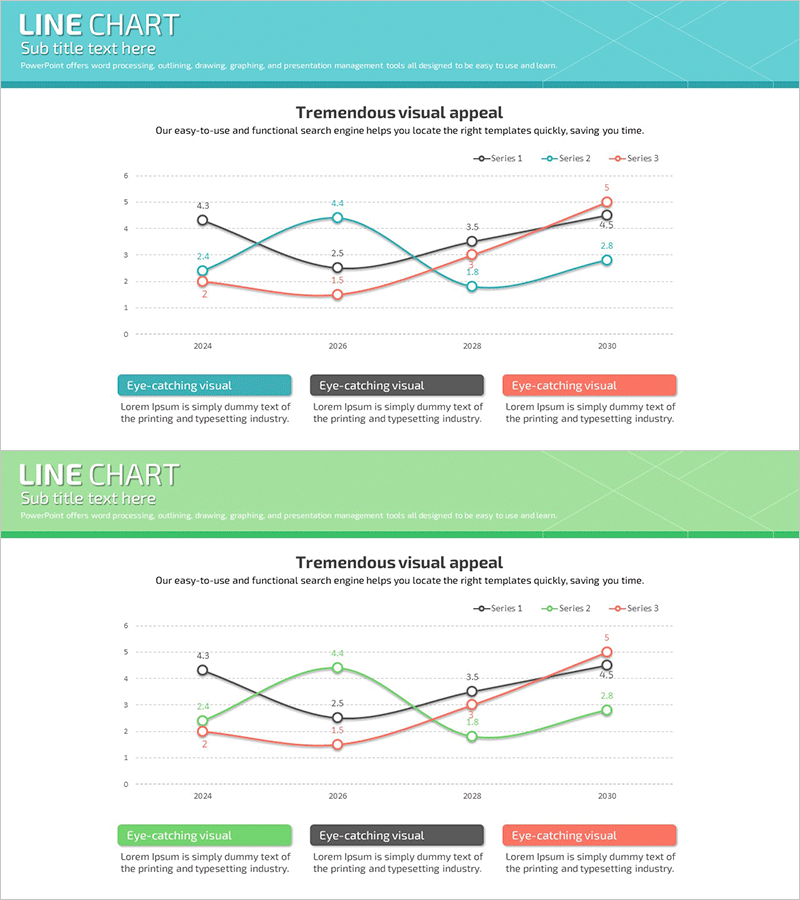
Visualizing Market Trends with Soft Line Graph
RJ0700001_10
- Last Update 12/21/2025
- File Size 0.6MB
- # of Slides 2
- File Format PPTX
- Slide Ratio 16:9
- Color
Keywords
About the Product
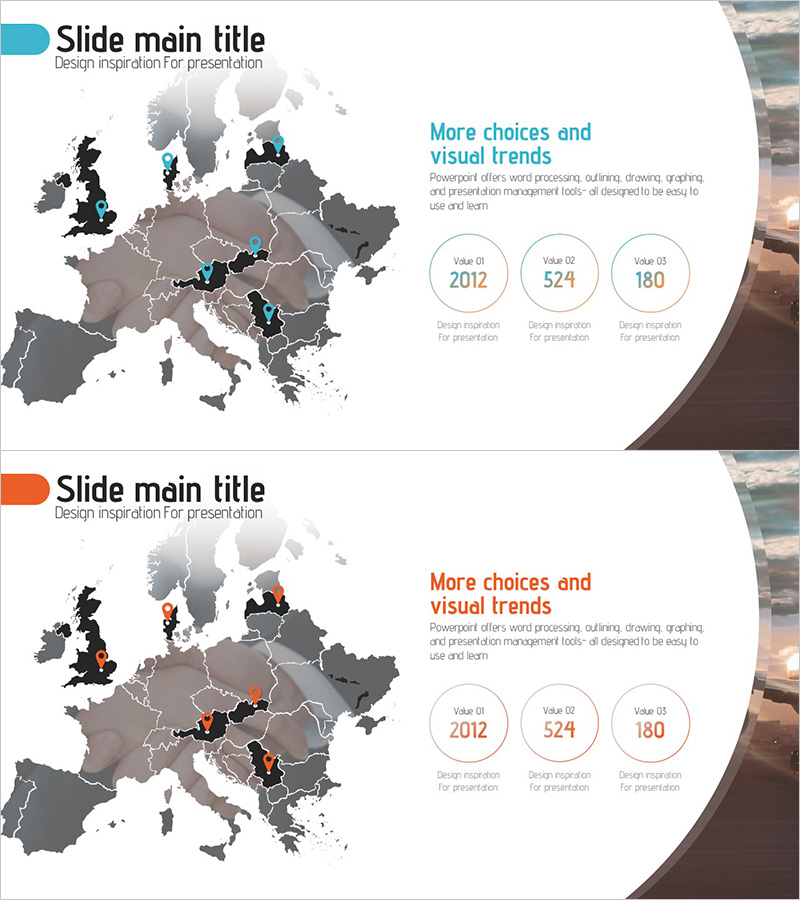
This slide presents a soft line graph that visualizes market and competitive scenarios intuitively. The elegant design and appealing color combinations add sophistication to presentation materials, helping audiences easily comprehend the data presented. With blue and green as primary colors, it provides a sense of visual stability, clearly delineating differences in data through line thickness and point arrangement. Ideal for market research, competitor analysis, or performance presentations, it aids professionals in effectively conveying their data.
Related Products
-
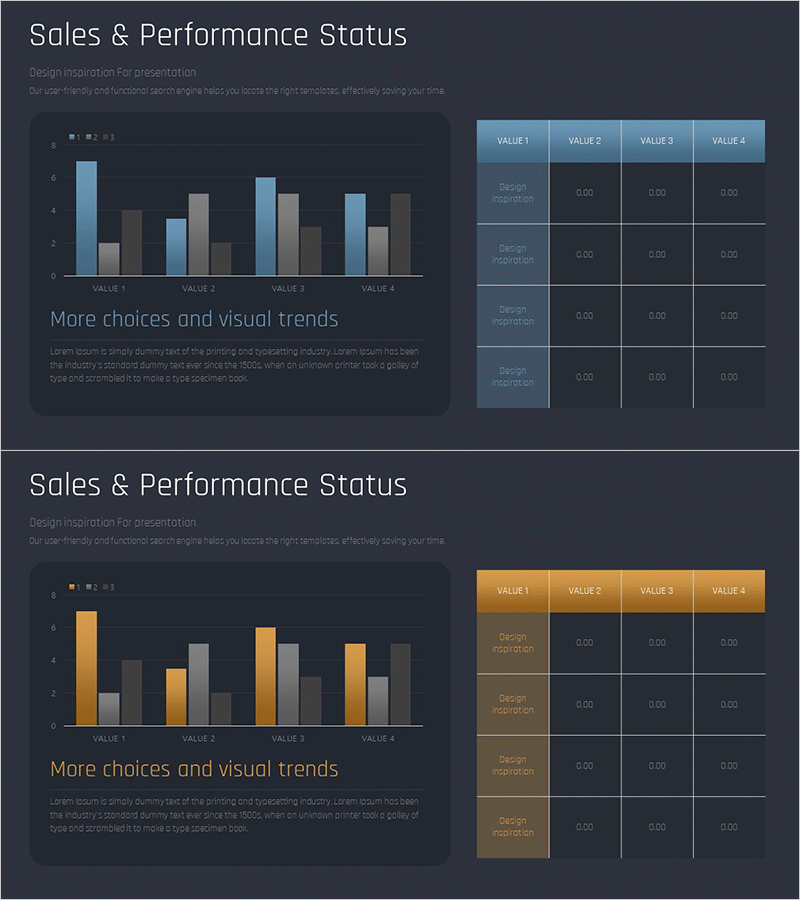
Sales & Performance Status Slide – Data-Driven Insights
#Company Introduction #Market and Competitor Analysis #Diagram
-
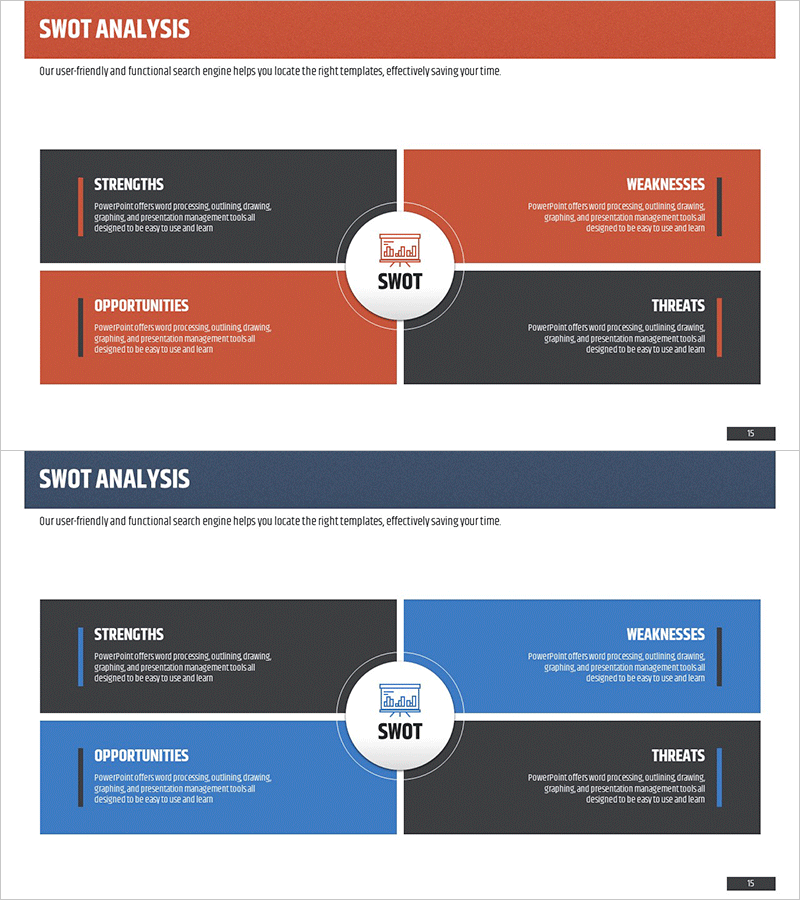
SWOT Analysis Diagram – Essential Tool for Market Analysis
#Market and Competitor Analysis #Diagram #SWOT Analysis
-
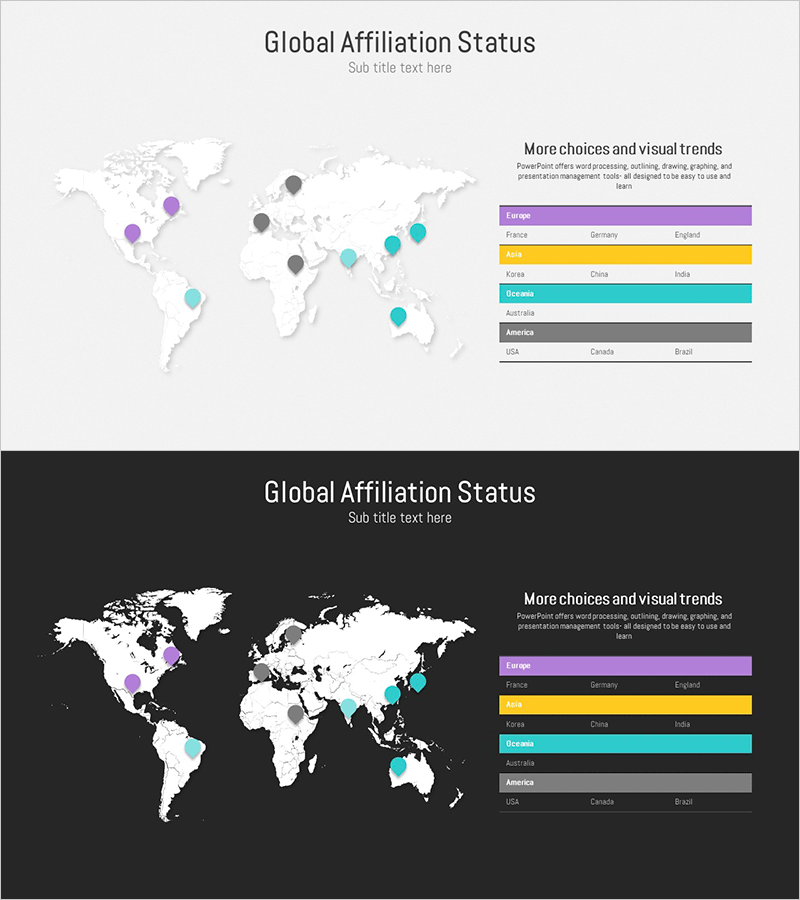
Target Country Analysis Table by Continent – Market and Competitor Analysis
#Company Introduction #Market and Competitor Analysis #Diagram
-
Business Target Area & Company Overview – Effective Market Approach
#Company Introduction #Market and Competitor Analysis #Other
