SWOT Analysis Diagram – Essential Tool for Market Analysis
RM0200003_14
- Last Update 02/01/2025
- File Size 2.8MB
- # of Slides 2
- File Format PPTX
- Slide Ratio 16:9
- Color
Keywords
- #Content-Based Slides
- #Design-Based Slides
- #Market and Competitor Analysis
- #Diagram
- #SWOT Analysis
- #Market Analysis
- #Spread
- #Centralized Diagram
- #16:9
- #SWOT analysis diagram
- #SWOT analysis PowerPoint slide
- #4-quadrant SWOT template
- #market analysis diagram
- #competitive analysis slide
- #SWOT framework PowerPoint
About the Product
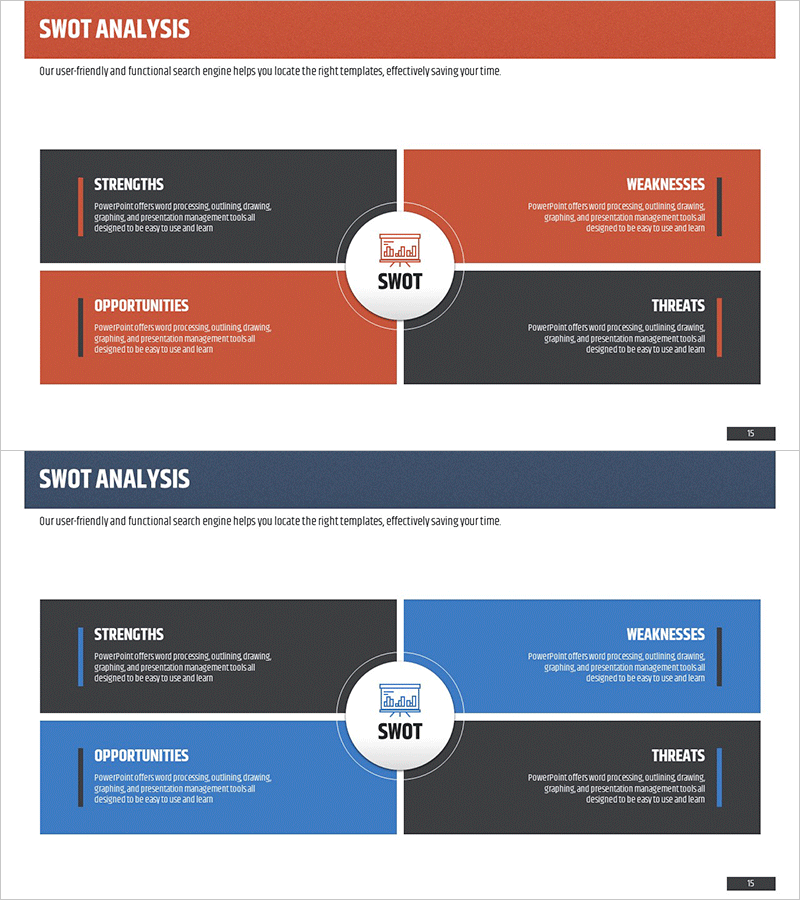
A PowerPoint slide featuring a centered SWOT icon with four quadrants for analyzing Strengths, Weaknesses, Opportunities, and Threats. Available in two color schemes (orange-black and blue-black), each quadrant contains independent text boxes for immediate use in market analysis, competitive analysis, and strategic planning. Delivered in 16:9 widescreen PPTX format with fully editable elements, perfect for business presentations, strategic reports, and planning documents.
Usage Points
-
Main Usage
Systematically analyze and visualize organizational strengths, weaknesses, opportunities, and threats for strategic planning. Ideal for executive briefings, business plans, and marketing strategy documents requiring a core strategic framework in the market analysis section.
-
How to Use
Simply input content into each quadrant's text box for immediate deployment. Select your preferred color scheme to match corporate branding or presentation theme, then customize background colors and text sizing as needed for your specific context.
-
Recommended For
Executives, strategy teams, marketing departments, and business development teams presenting at board meetings, strategic planning workshops, and investor presentations. Supports decision-making during new market entry evaluation, competitive strategy development, and market opportunity assessment.
-
Slide Structure
Central circular SWOT icon surrounded by four rectangular quadrants in symmetric layout. Top-left: dark gray Strengths, top-right: orange/blue Weaknesses, bottom-left: orange/blue Opportunities, bottom-right: dark gray Threats, creating balanced visual hierarchy.
Related Products
-

SWOT Analysis of Children's Music Activities – Effective Strategy Development
#Market and Competitor Analysis #Diagram #SWOT Analysis
-

SWOT Analysis Arrow Circular Diagram - Market and Competitor Analysis
#Market and Competitor Analysis #Diagram #SWOT Analysis
-

Circle Split SWOT Analysis Diagram – New Horizons in Market Analysis
#Market and Competitor Analysis #Diagram #SWOT Analysis
-

SWOT Segmentation Diagram – The Perfect Choice for Market Analysis
#Market and Competitor Analysis #Diagram #SWOT Analysis
