Business Target Area & Company Overview – Effective Market Approach
RJ0300067_18
- Last Update 05/07/2025
- File Size 1.6MB
- # of Slides 2
- File Format PPTX
- Slide Ratio 16:9
- Color
Keywords
- #Content-Based Slides
- #Design-Based Slides
- #Company Introduction
- #Market and Competitor Analysis
- #Other
- #Company Overview
- #Target Market
- #Map
- #16:9
- #Europe map PowerPoint slide
- #regional target market slide
- #business geography presentation
- #how to show market regions in PowerPoint
- #company overview map slide
About the Product
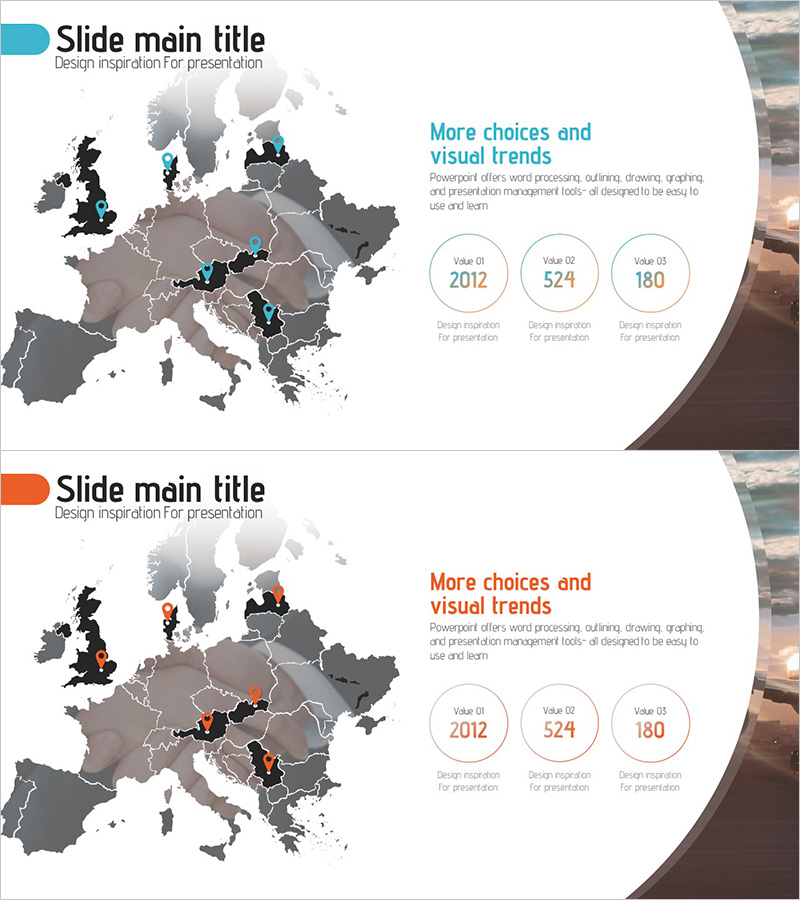
A professional PowerPoint slide set featuring a Europe map for visualizing business target regions and company overview. Ideal for global business presentations where you need to highlight market penetration areas or regional expansion strategy. The design uses a dark-toned map background with cyan or orange point markers to indicate key regions, paired with a text area and three circular metric indicators on the right side. This 2-slide set provides color variations (cyan and orange) so you can match your presentation tone. Fully editable PPTX format ready for immediate use.
Usage Points
-
Main Usage
Visually communicate your company's global business footprint and market presence to investors, partners, and stakeholders. Use this slide in company overview or market analysis sections to clearly show which geographic regions your business targets or operates in.
-
How to Use
Insert this slide into your company overview or market analysis section. Replace the map markers with your actual business regions and update the text area with region-specific metrics such as revenue, customer count, or market share. Leverage the two color variations to differentiate sections or match your presentation's visual theme.
-
Recommended For
Ideal for global company presentations, investor pitch decks, market analysis reports, and business expansion plans. Particularly effective when presenting to executives, investors, and business partners who need to understand your geographic market strategy and regional performance.
-
Slide Structure
Left half displays a Europe map with dark background and country borders; right half contains a title/description text area plus three circular charts showing key metrics. Map features cyan or orange point markers and connecting lines to highlight target regions. The 2-slide set offers color variations for flexible presentation use.
Related Products
-

Target Market Goal Map for Global Market Analysis
#Company Introduction #Market and Competitor Analysis #Other
-

Slide Template for European Target Market Goals
#Market and Competitor Analysis #Marketing Plan and Strategy #Other
-

Target Country Analysis Map – Insights into Global Markets
#Company Introduction #Market and Competitor Analysis #Graph
-

Global National Goal Setting Map – Target Market Visualization
#Company Introduction #Market and Competitor Analysis #Other
