Graph
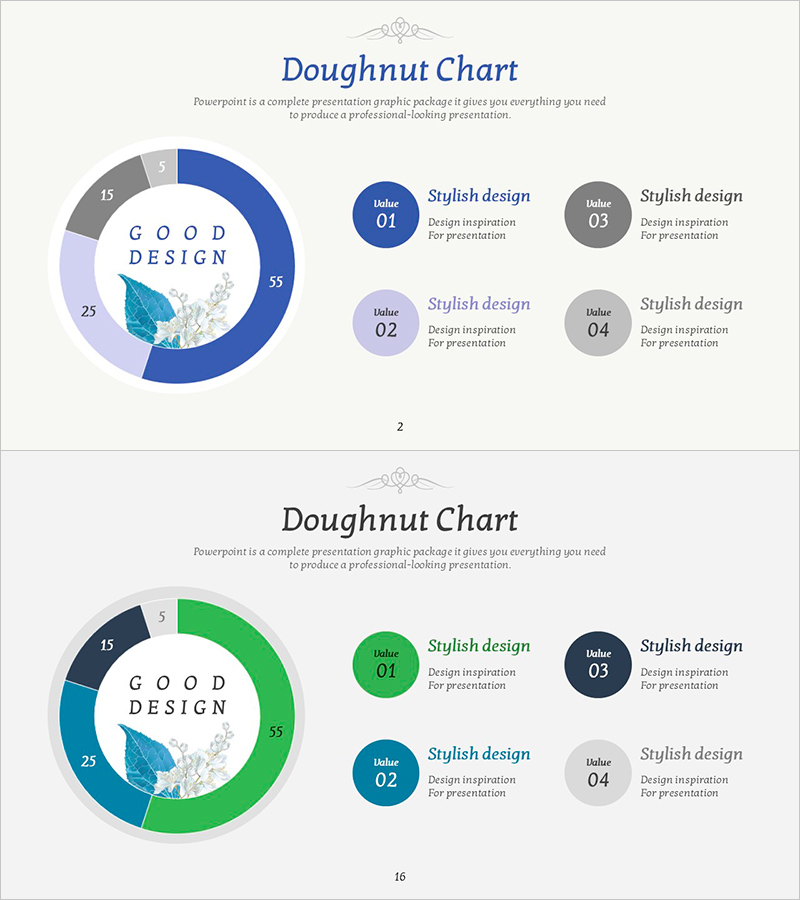
Purple Green Donuts Chart Analysis
RJ0600108_15
- Last Update 12/21/2025
- File Size 0.8MB
- # of Slides 2
- File Format PPTX
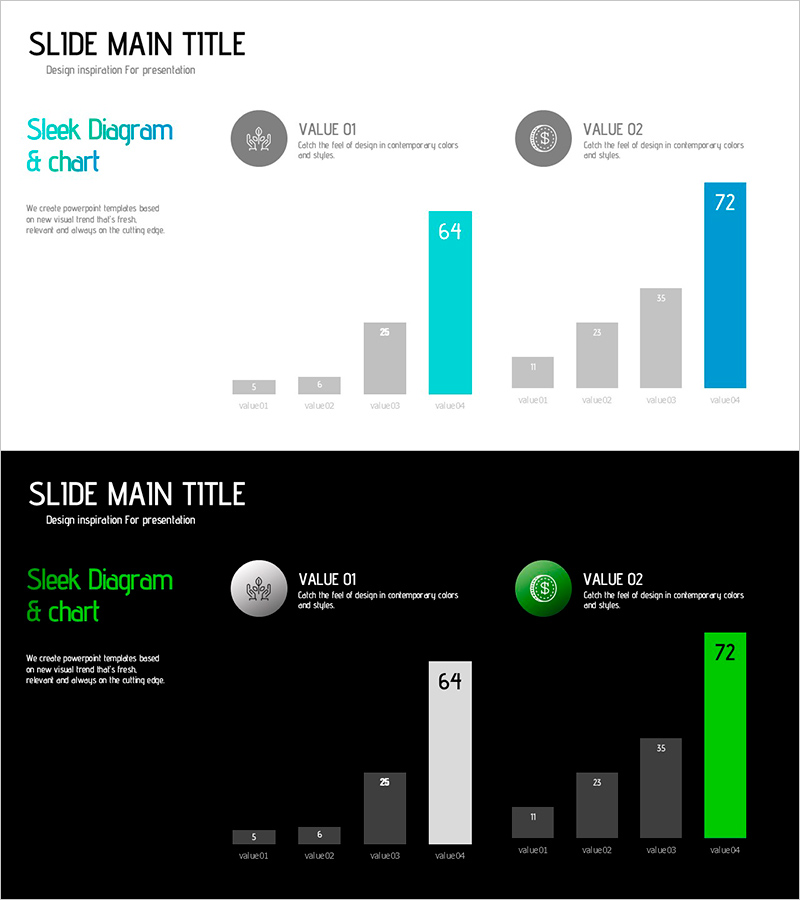
- Slide Ratio 16:9
- Color
Keywords
About the Product
This slide utilizes a purple-green color scheme doughnut chart for visually analyzing data. With its sophisticated design, it clearly communicates key information and allows for easy comparison of various figures and details at a glance. Ideal for business presentations or data analysis reports, this slide helps capture the audience's attention and effectively conveys information. Editing is also easy, allowing for quick customization with simple text and number replacements.
Related Products
-
Competitor Comparison Analysis Graph - Highlighting Competitive Advantage
#Market and Competitor Analysis #Graph #Competitor Analysis
-
Premium Presentation Slide Visualized with Gradient Donut Chart
#Product/Service #Business Introduction #Diagram
-
100% Stacked Column Chart by Subject – Effective Market Analysis
#Market and Competitor Analysis #Diagram #Graph
-
Donation Participation Rate Graph – Business Strategy and Future Outlook
#Business Promotion Strategy #Market and Competitor Analysis #Graph
