Business Promotion Strategy
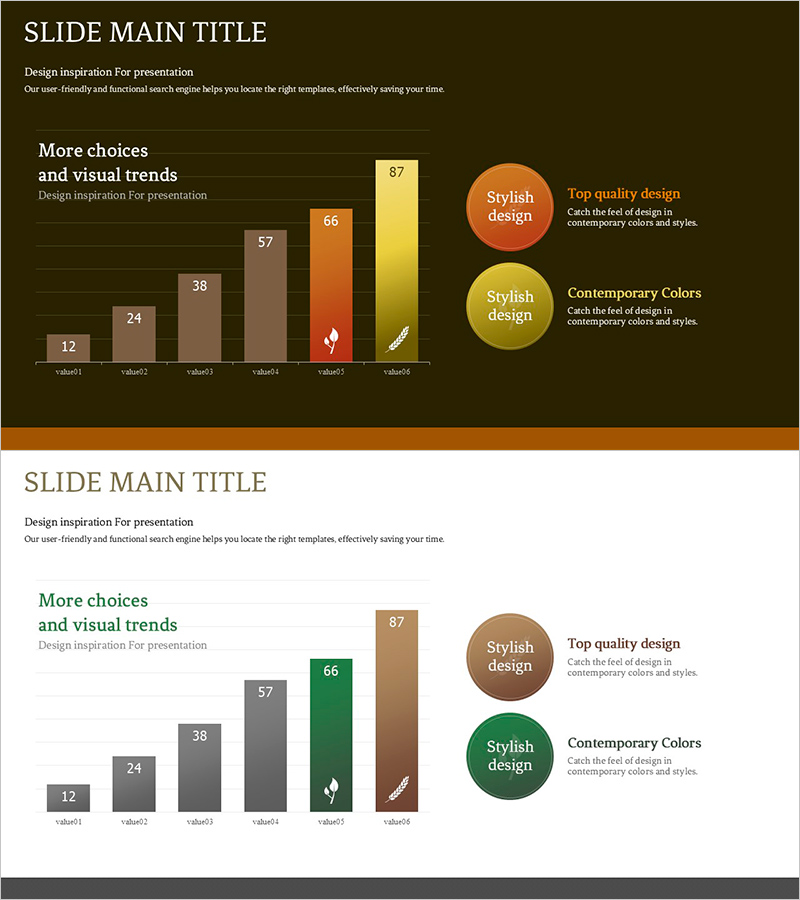
Growing Demand for Organic Agricultural Products Bar Chart
RJ0600096_13
- Last Update 12/21/2025
- File Size 0.1MB
- # of Slides 2
- File Format PPTX
- Slide Ratio 16:9
- Color
Keywords
About the Product
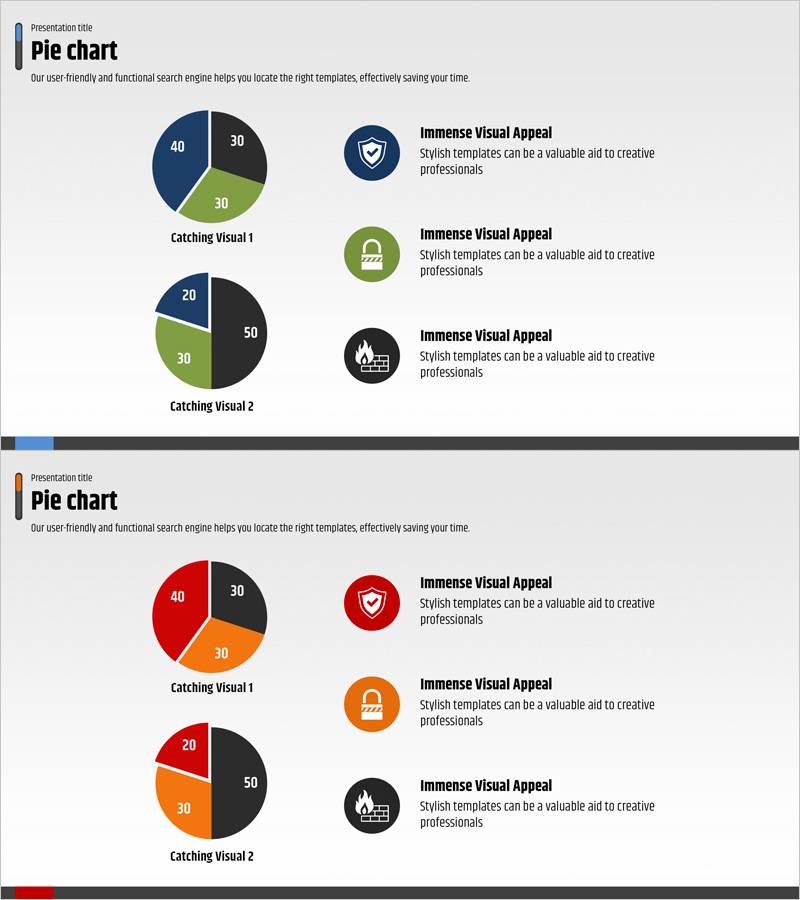
This slide visually represents the growing demand for organic agricultural products through a bar chart format. Utilizing eco-friendly colors such as green, orange, and brown, it emphasizes the significance of the organic industry. The graph presents data in a concise and clear manner, effectively showcasing the market growth potential of organic products. It is particularly suitable for business strategies and market competitive analysis materials. The slide is easy to edit, making it convenient for content updates, while its user interface is intuitive. This slide will serve as a powerful visual aid in contexts such as attracting investments or proposing partnerships.
Related Products
-
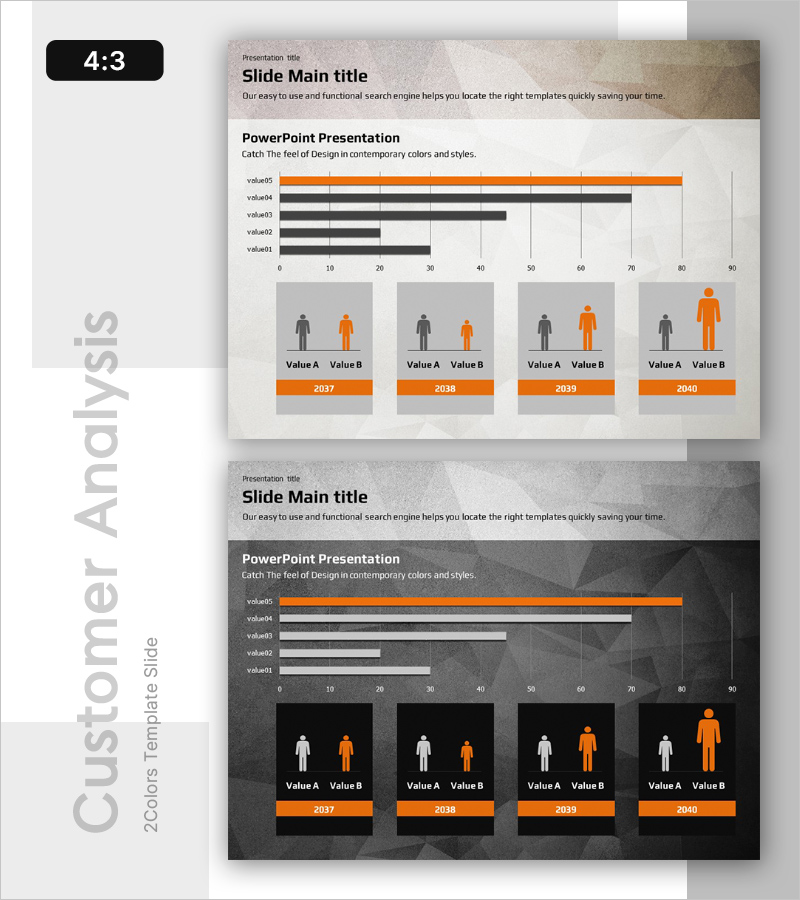
Customer Behavior Analysis by Country – Strategic Business Proposal
#Business Promotion Strategy #Market and Competitor Analysis #Diagram
-
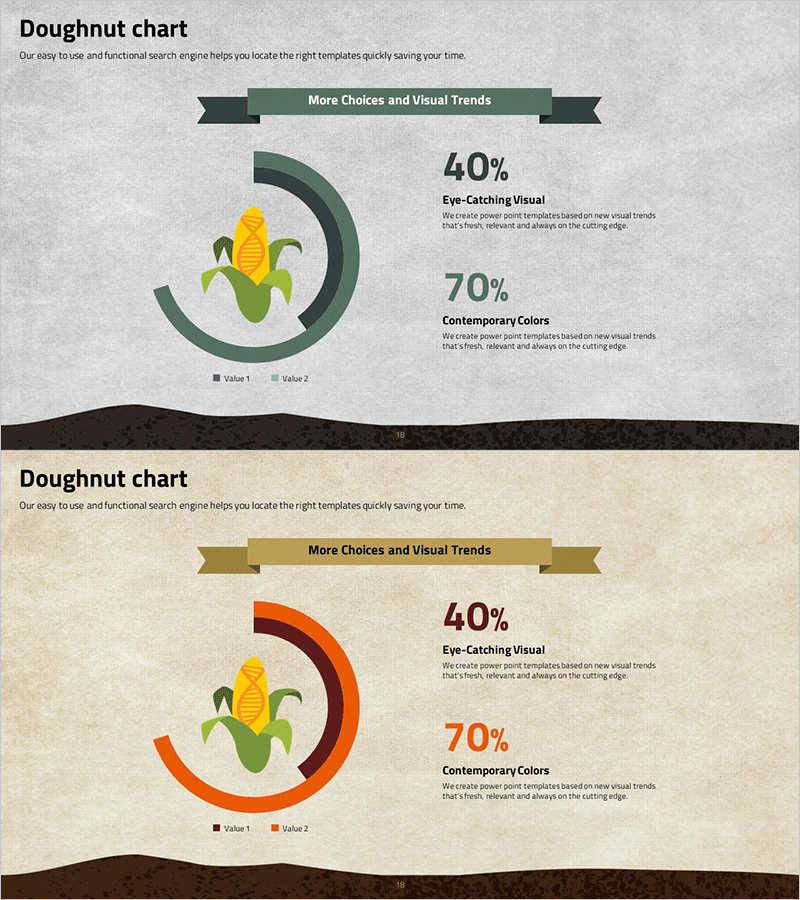
Genetically Modified Corn Analysis Circle Graph – Showcasing Competitive Advantage
#Market and Competitor Analysis #Graph #Competitive Advantage
-
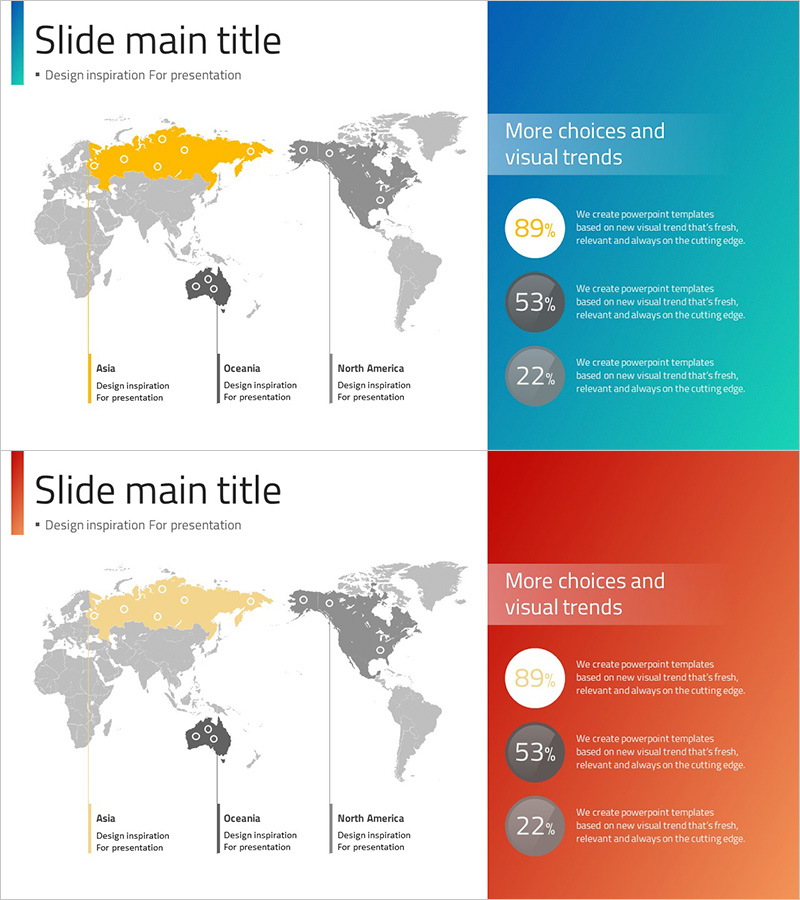
Map Slide for Geographical Data Visualization - Modern Design
#Company Introduction #Market and Competitor Analysis #Other
-
Visualizing Market Share and Status with Pie Chart
#Market and Competitor Analysis #Graph #Market Status
