Map Slide for Geographical Data Visualization - Modern Design
RJ0300080_8
- Last Update 05/11/2025
- File Size 1.4MB
- # of Slides 2
- File Format PPTX
- Slide Ratio 16:9
- Color
Keywords
About the Product
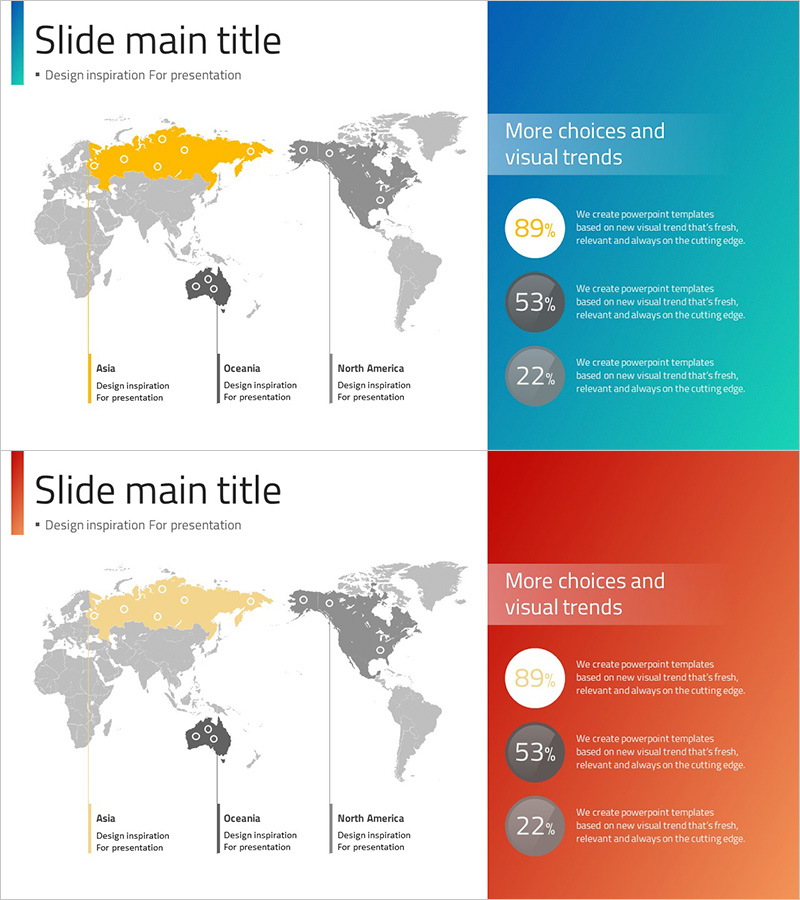
A 2-slide map PowerPoint template designed to visualize geographical data and regional distribution effectively. The first slide features a world map with color-highlighted regions (Russia, Asia, Oceania, North America) and editable text labels for each area. The second slide combines a world map on the left with statistical information on the right, displaying three data points (89%, 53%, 22%) using circular charts against a blue and teal gradient background. Available in 16:9 widescreen PPTX format, fully editable and ready to use for market analysis, global strategy presentations, and regional performance reports.
Usage Points
-
Main Usage
Present global market conditions, regional business distribution, and country-specific performance data in a single visual format. The color-highlighted world map draws attention to key regions while integrated statistics reinforce data credibility and support decision-making.
-
How to Use
On the first slide, select regions to highlight and modify colors, then add descriptive text for each area. On the second slide, edit region names, update statistical figures, and adjust circular chart data to reflect actual numbers. Choose from available color schemes (blue, teal, red, orange) to match your presentation theme.
-
Recommended For
Global corporate regional business presentations, market analysis reports with geographical distribution, investment pitch decks highlighting global networks, marketing strategy documents showing target market analysis, and consulting proposals presenting country-specific opportunities.
-
Slide Structure
Slide 1: World map with 3 color-highlighted regions + 3 text input areas (Asia, Oceania, North America). Slide 2: Left-side world map + right-side statistics section with title, 3 circular charts, and descriptive text. Total 2 slides with regional comparison structure.
Related Products
-

Target Market Global Network Map – Visualizing Business Strategy
#Company Introduction #Market and Competitor Analysis #Other
-

Global National Goal Setting Map – Target Market Visualization
#Company Introduction #Market and Competitor Analysis #Other
-

Global Network Target Region Analysis – Stylish Design Visualization
#Company Introduction #Market and Competitor Analysis #Other
-

Global Target Country Map – Essential Tool for Market Analysis
#Company Introduction #Market and Competitor Analysis #Other
