Graph
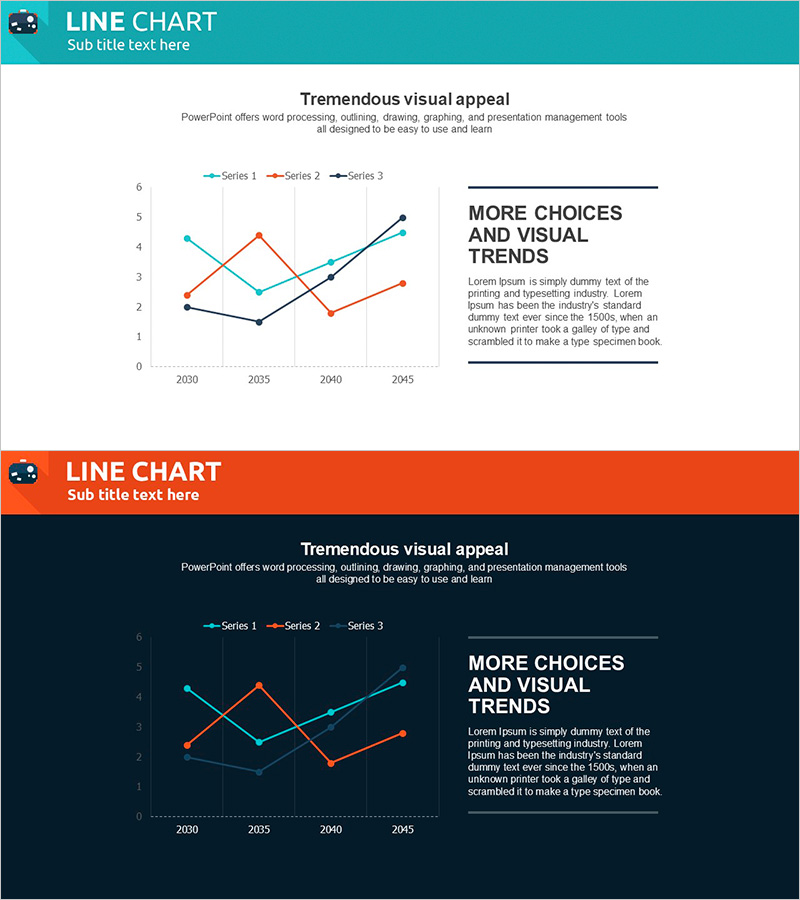
World Travel Break Line Chart Analysis – The Allure of Data Visualization
RJ0600080_29
- Last Update 12/21/2025
- File Size 0.2MB
- # of Slides 2
- File Format PPTX
- Slide Ratio 16:9
- Color
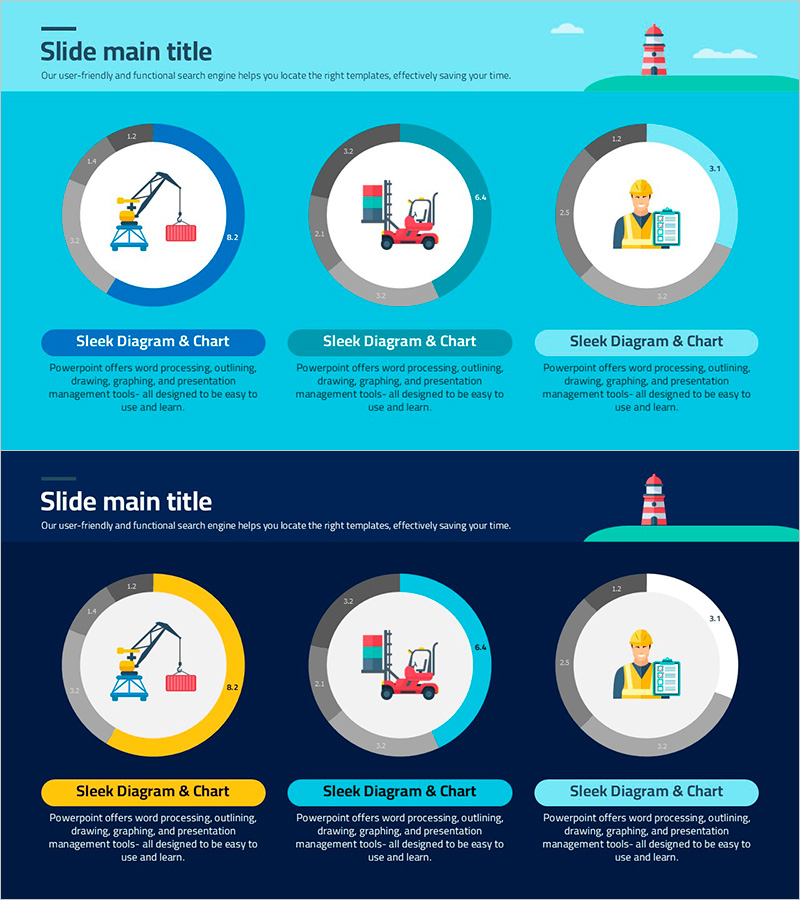
About the Product
This slide intuitively analyzes the trends of world travel data using a break line chart. With a harmonious color scheme of red and teal, it captures audience attention while facilitating easy grasp of trends over time. Ideal for travel market analysis, investment proposals, and business planning presentations, this design effectively highlights critical data points, making information delivery impactful.
Related Products
-
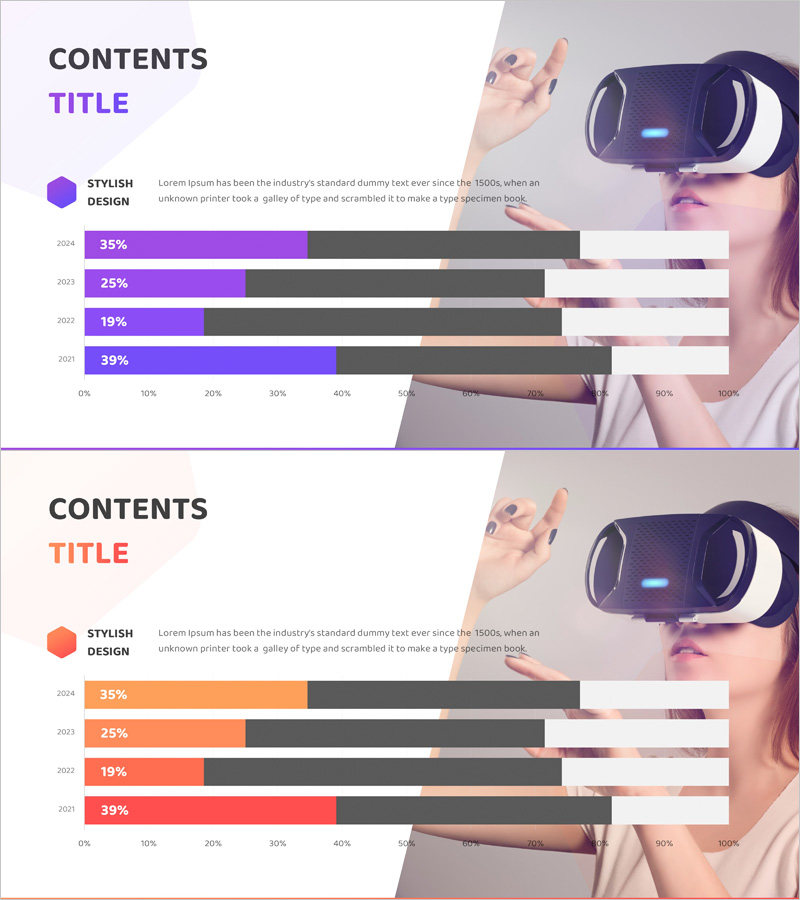
VR Market Analysis Bar Graph – Understanding Competitive Landscape
#Market and Competitor Analysis #Graph #Competitor Analysis
-
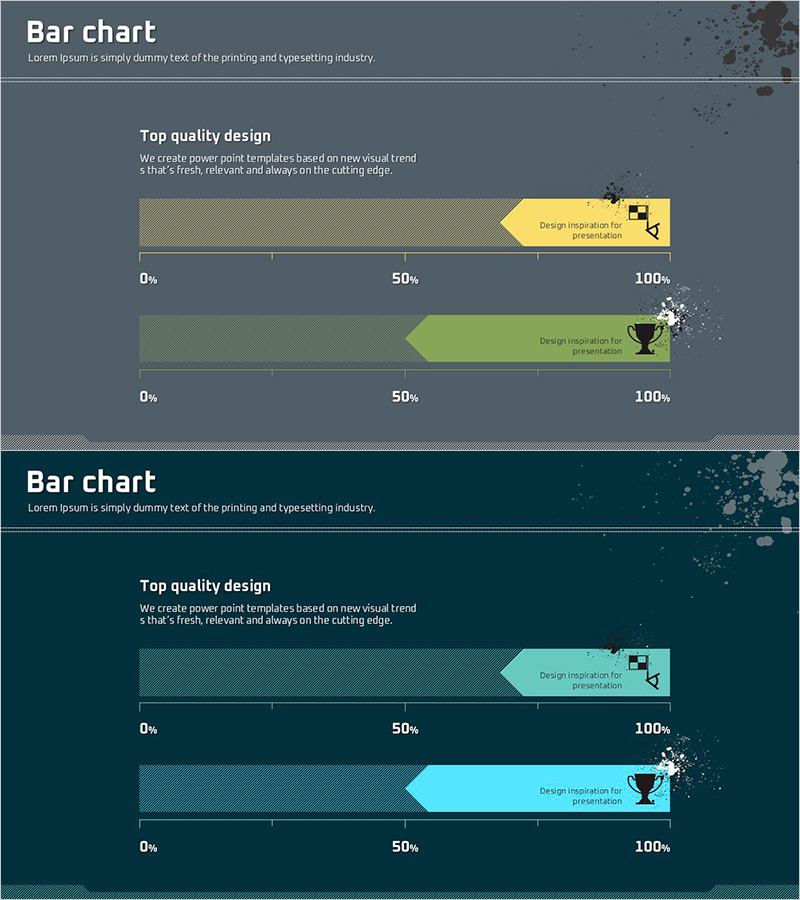
Arrow Charts for the Games – Intuitive Data Visualization
#Graph
-
Stripe Template Bundle Bar Graph – Benefits of Data Visualization
#Graph
-
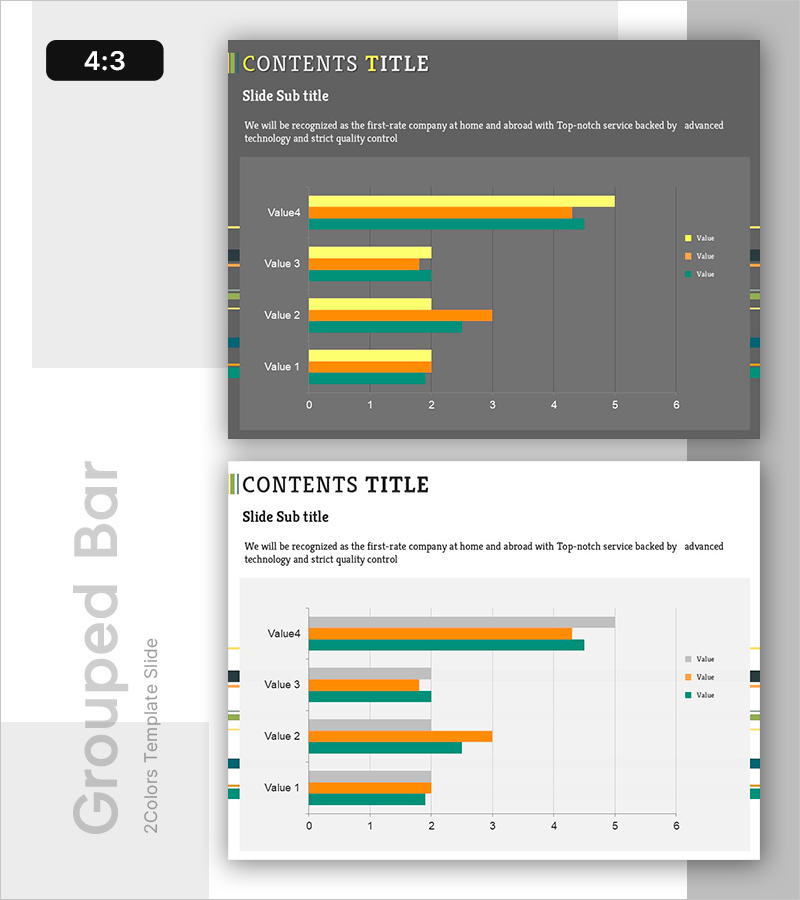
Logistics Market Share Chart – Current Status and Competitive Analysis
#Market and Competitor Analysis #Graph #Market Status
