Arrow Charts for the Games – Intuitive Data Visualization
RJ0600037_14
- Last Update 06/30/2025
- File Size 0.7MB
- # of Slides 2
- File Format PPTX
- Slide Ratio 16:9
- Color
Keywords
About the Product
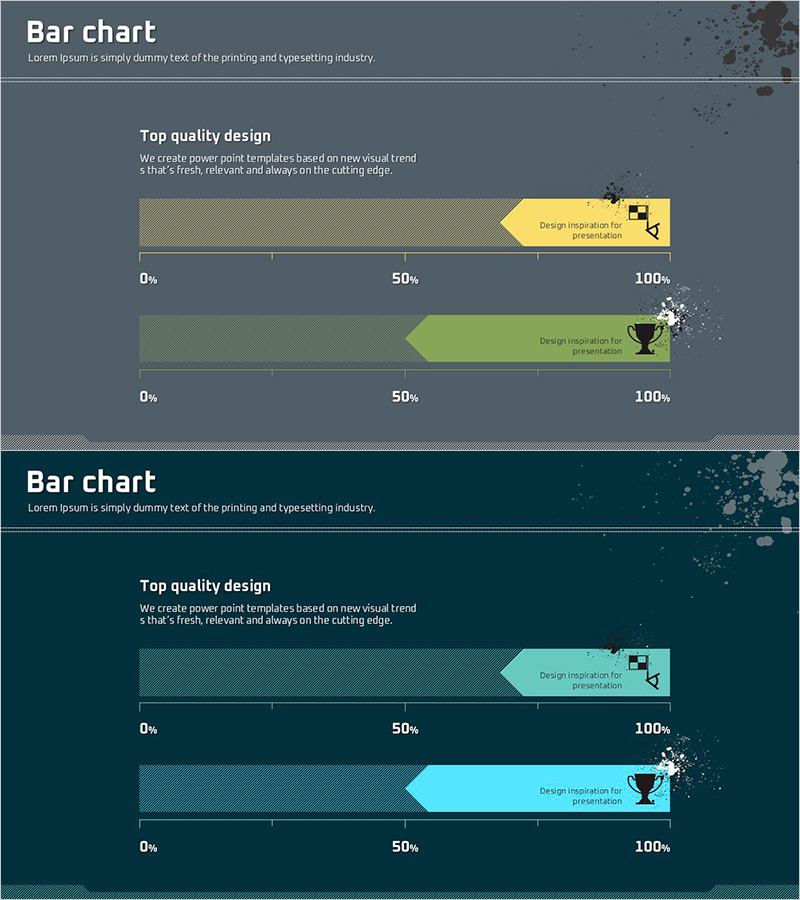
An intuitive arrow chart PowerPoint slide that visualizes performance metrics and progress tracking from 0% to 100%. This presentation template uses arrow-shaped graphics to clearly communicate goal achievement rates, performance comparisons, and milestone progress. The set includes 2 slides with distinct color schemes—beige and yellow on the first slide, green and cyan on the second—allowing flexible application across various presentation contexts. Delivered in 16:9 widescreen PPTX format, optimized for modern presentation environments and fully editable for customization.
Usage Points
-
Main Usage
Communicate project progress, goal achievement rates, performance comparisons, and completion percentages using arrow-shaped graphics that enhance audience comprehension and engagement.
-
How to Use
Ideal for business reports (performance sections), marketing presentations (campaign progress), project management updates, quarterly results comparisons, and executive briefings where quantitative progress must be visually emphasized.
-
Recommended For
Project managers, marketing professionals, sales directors, business analysts, and executives who need to present quantitative performance data clearly and persuasively.
-
Slide Structure
Two-slide set with 0%–100% progress axes. Each slide displays two arrow charts for easy comparison. First slide uses beige and yellow tones; second slide features green and cyan gradients for visual differentiation.
Related Products
-

Efficient Presentation Through Data Visualization – Modern Square Slide Design
#Company Introduction #Market and Competitor Analysis #Graph
-

Communication Marketing Donut Chart – Performance Visualization
#Company Introduction #Market and Competitor Analysis #Graph
-

User Analysis Graph by Age Group – Advanced Data Insights
#Market and Competitor Analysis #Diagram #Graph
-

Road Bar Chart for Transportation Utilization
#Market and Competitor Analysis #Graph #Industry Trends
