Market and Competitor Analysis
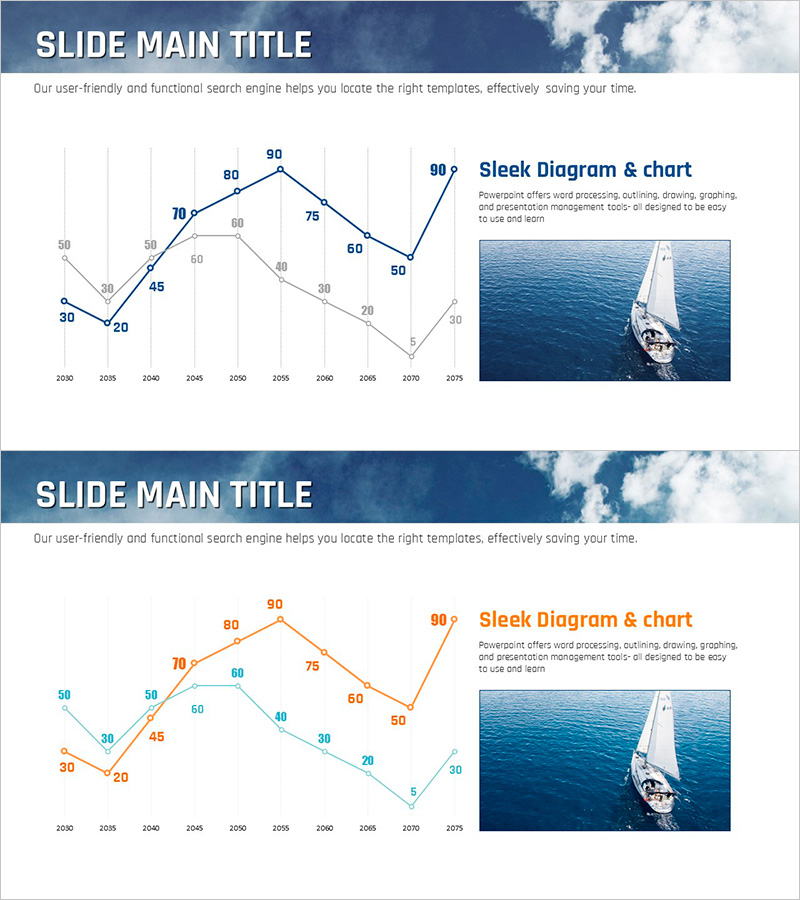
Sea Lighthouse Goal Market Strategy Line Graph – Revenue and Profit Growth
RJ0600079_20
- Last Update 12/21/2025
- File Size 33.7MB
- # of Slides 2
- File Format PPTX
- Slide Ratio 16:9
- Color
Keywords
About the Product
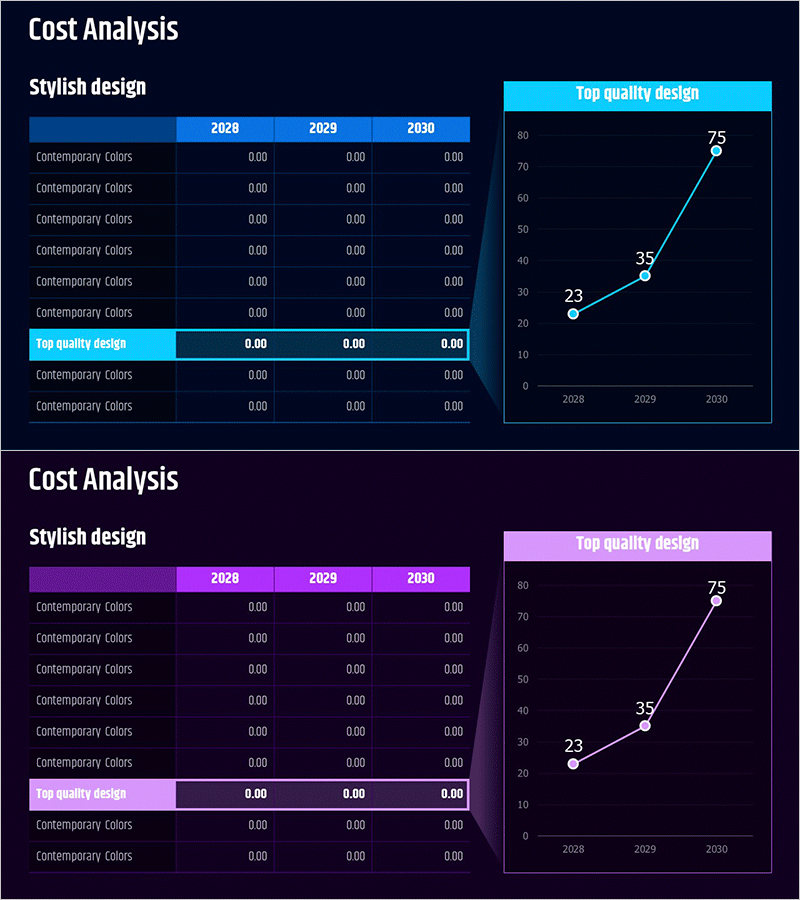
This slide features a line graph themed on a sea lighthouse, visualizing the performance of goal market strategy. With a harmonious color palette of blue and green, it enhances stability and trust, adopting a layout that clearly conveys data. It is suitable for analyzing market status and revenue, making it highly effective for business plan presentations and investment pitches. The text and graphic elements are easily replaceable, with an editing difficulty rated as 'easy'.
Related Products
-
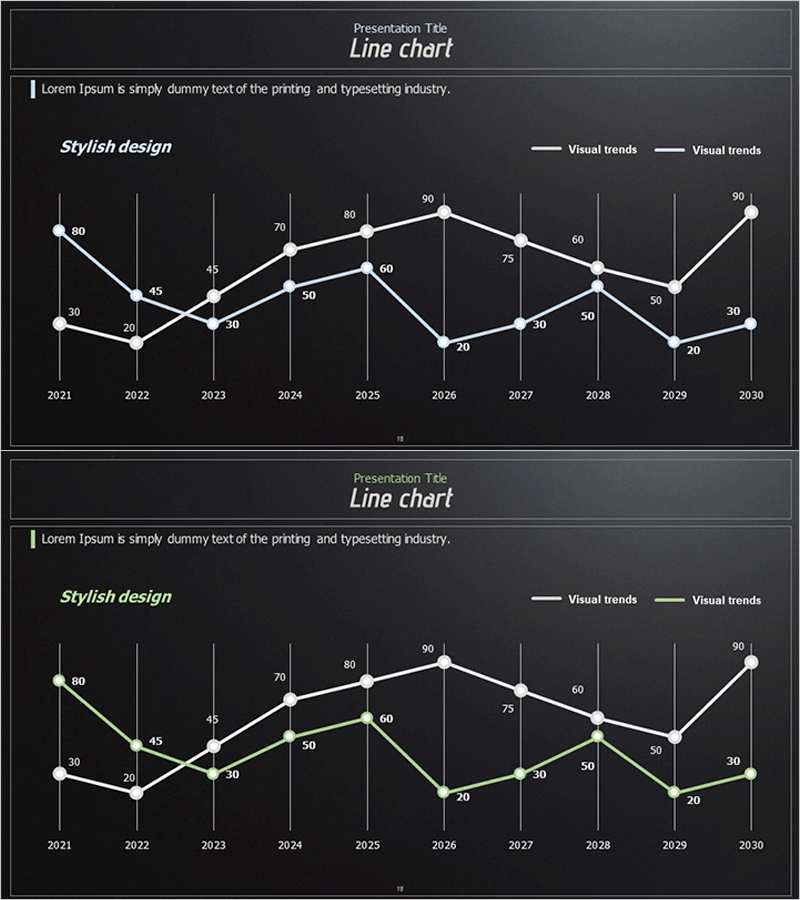
Blue Green Broken Line Graph – Optimized for Competitor Analysis Design
#Market and Competitor Analysis #Graph #Competitor Analysis
-
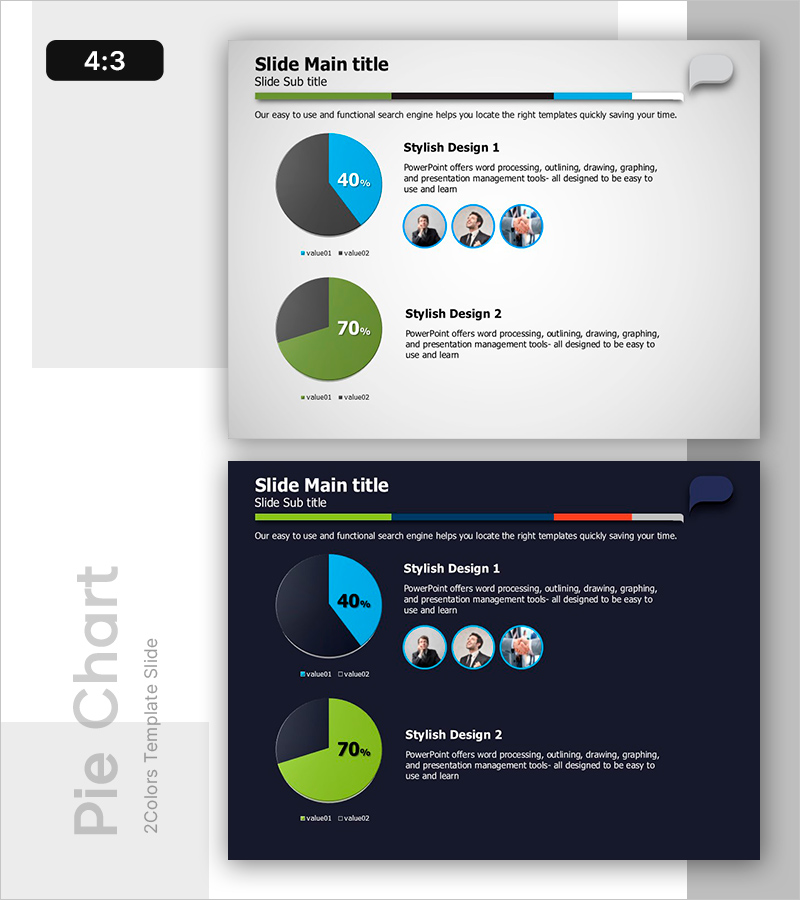
Two Pie Charts with Commentary – Market Share Analysis
#Market and Competitor Analysis #Graph #Market Status
-
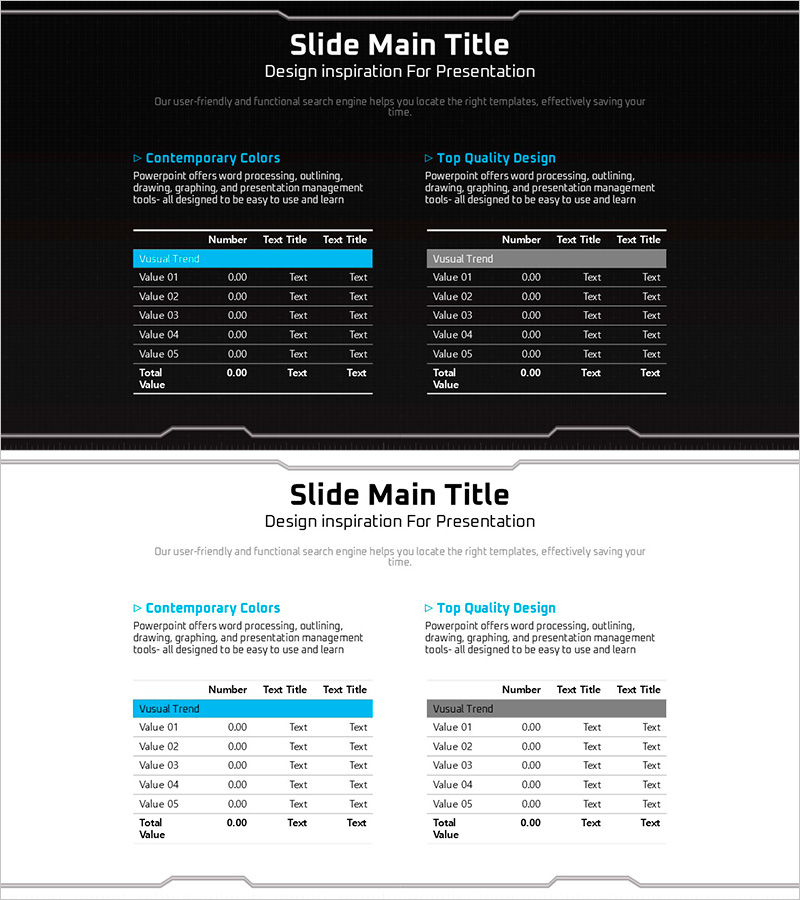
Geometry Pattern Wide Table PPT Template for Financial Planning and Performance
#Financial Plans and Performance #Diagram #Balance Sheet
-
Business Outlook Analysis Chart – Future Predictions and Planning
#Financial Plans and Performance #Diagram #Graph
