Free Graphs
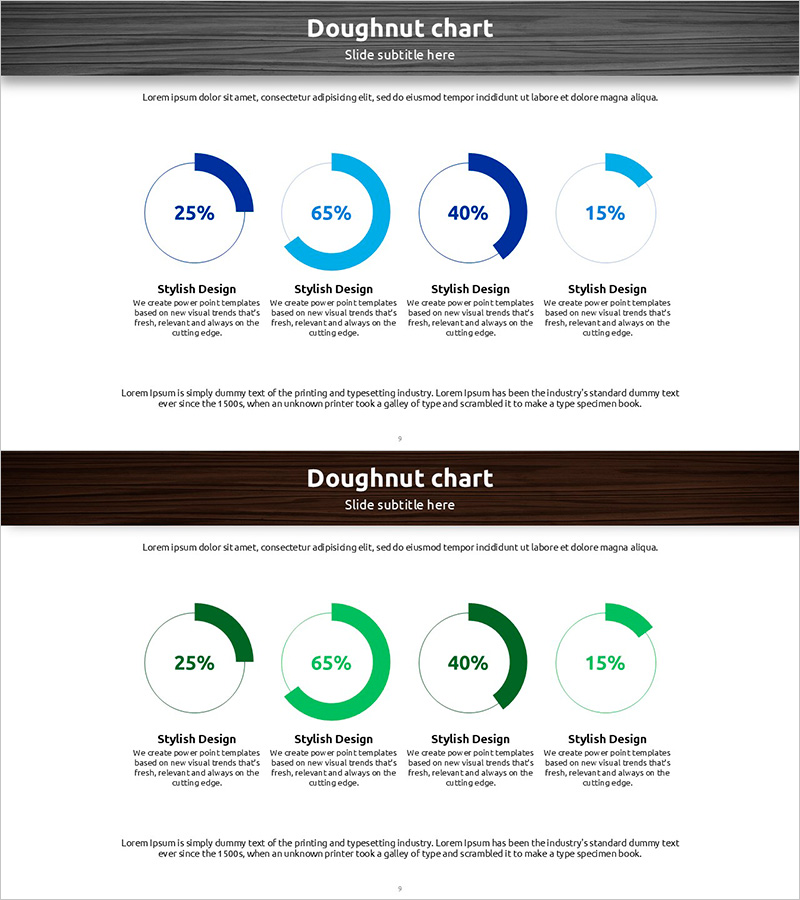
Free Blue Green Donut Chart – Stylish Data Visualization
RJ0600077_8
- Last Update 12/21/2025
- File Size 6.3MB
- # of Slides 2
- File Format PPTX
- Slide Ratio 16:9
- Color
Keywords
About the Product
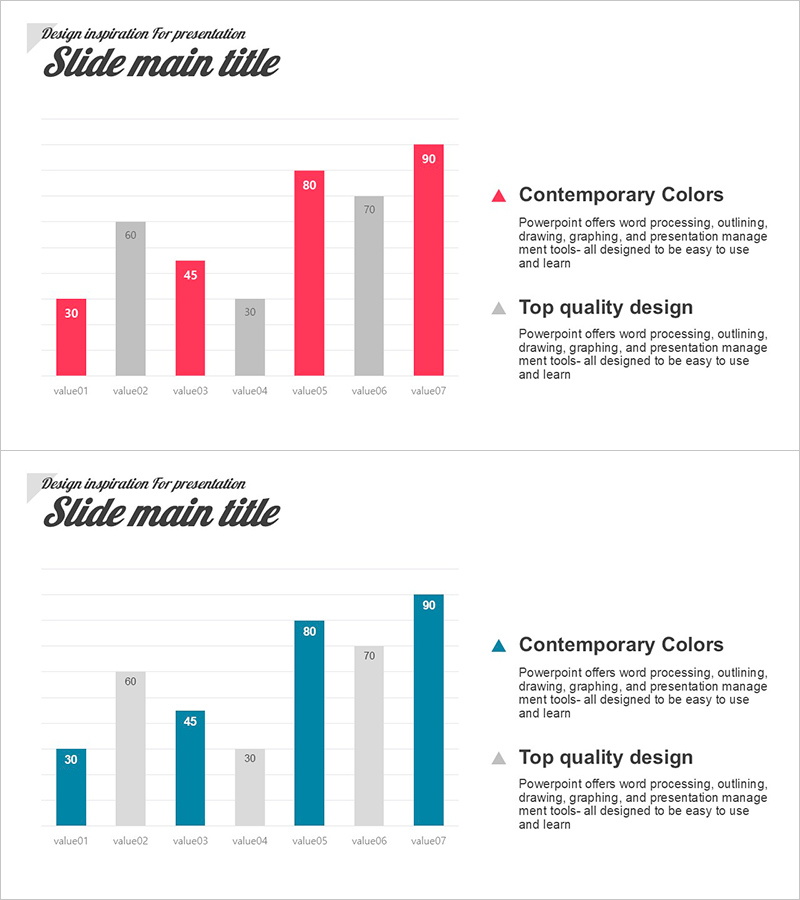
This slide features a donut chart with blue and green colors, visually conveying data proportions. Its circular structure clearly organizes data to intuitively communicate key information to the audience, distinguished by a modern and elegant design. Ideal for various business presentations, marketing reports, or research outcome presentations, it significantly enhances the understanding of data analysis. Text and data fields are easy to replace, with an overall editing difficulty rated as 'medium', allowing for seamless integration into presentations.
Related Products
-
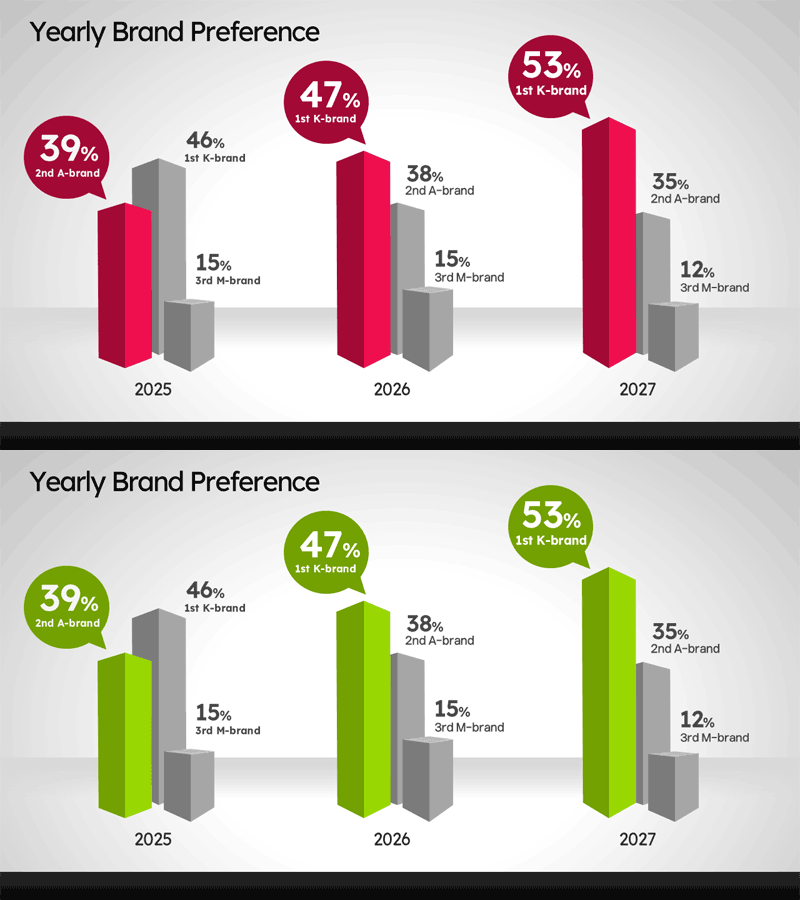
Free 3-Year Brand Preference Vertical 3D Bar Chart PowerPoint Template – Yearly Data Comparison Slide
#Free Graphs
-
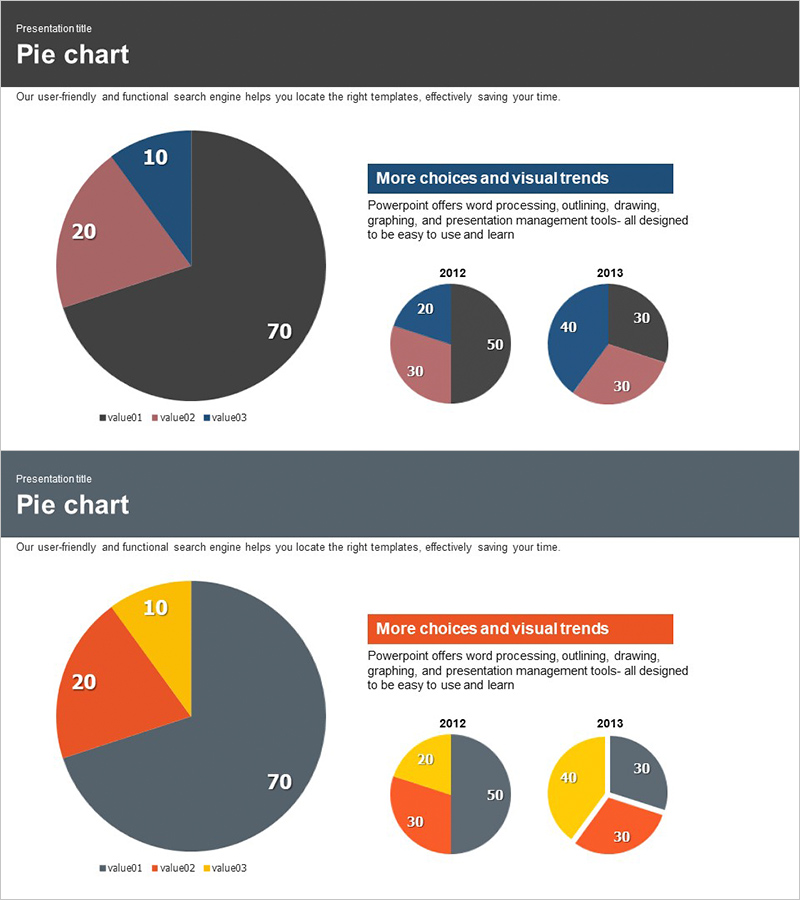
Market Share Comparison Pie Chart – Market Analysis
#Free Graphs
-
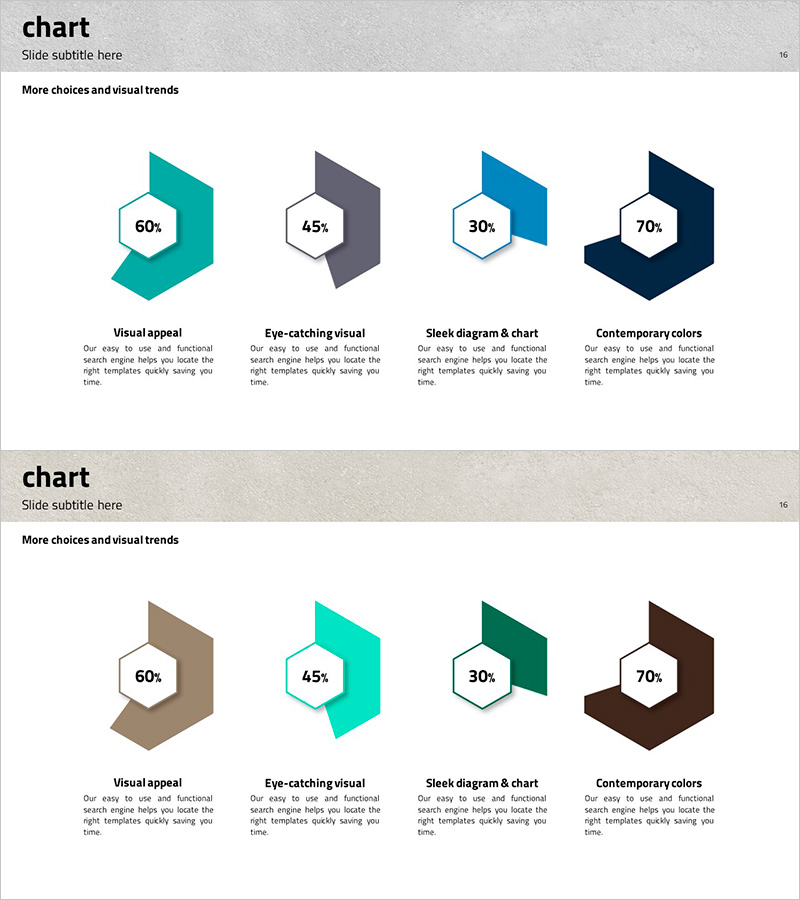
Introducing Products and Services with Hexagonal Chart – Achieving Marketing Goals
#Free Graphs
-
Data Visualization with Bar Chart – A Blueprint of Modern Design
#Free Graphs
