Free 3-Year Brand Preference Vertical 3D Bar Chart PowerPoint Template – Yearly Data Comparison Slide
OG0100001
- Last Update 11/11/2025
- File Size 0.1MB
- # of Slides 2
- File Format PPTX
- Slide Ratio 16:9
- Color
Keywords
About the Product
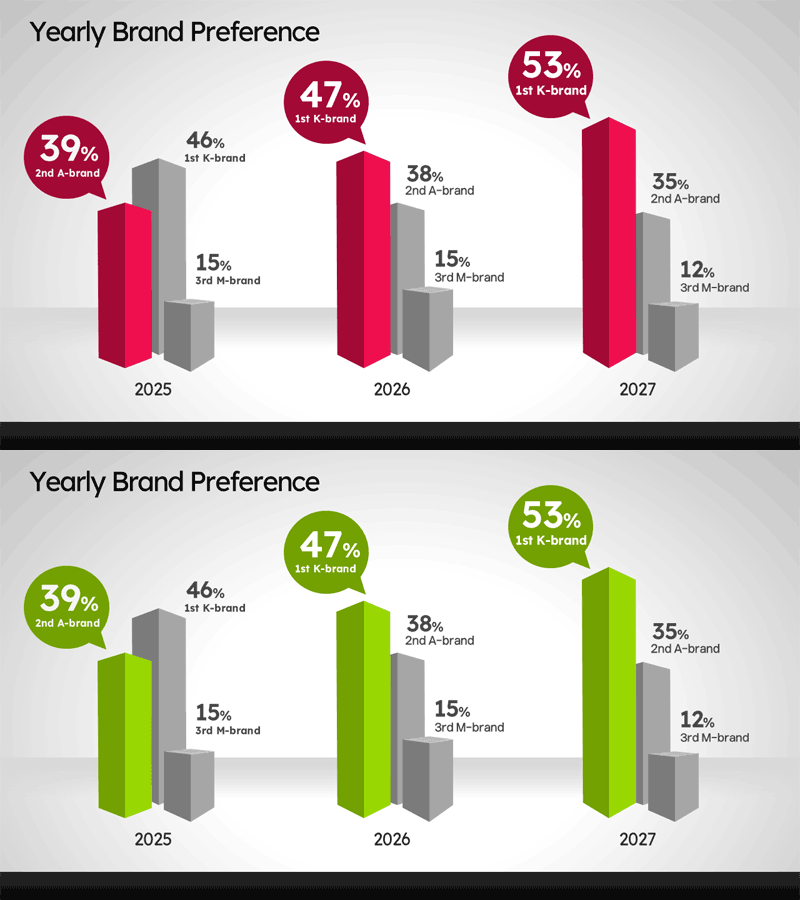
This free PowerPoint slide features a 3D vertical bar chart comparing brand preference across three years (2025–2027) for three competing brands. Set against a light gray gradient background with a dark bottom bar, the slide uses crimson red and lime green color versions so you can match your brand identity. Circular callout shapes highlight the top-ranked brand's percentage for each year, making key data instantly visible. Nine 3D bars are arranged in three yearly groups, with editable year labels, brand names, and percentage values throughout. Whether you're building a marketing report, competitive analysis, or annual performance presentation, this slide deck element integrates seamlessly. For more graph and chart slides in similar styles, explore the full collection at GoodPello.
Usage Points
-
Main Usage
Designed to visually compare brand preference or market share across three brands over multiple years, this slide is ideal for marketing reports, competitive analysis decks, and annual performance presentations where clear data comparison is essential.
-
How to Use
Replace the year labels, brand names, and percentage values with your actual data. Choose between the crimson red or lime green color version to match your brand palette, and update the circular callout figures to reflect your top-ranked data point.
-
Recommended For
Best suited for marketing managers, brand strategists, market research analysts, and business consultants who need to present multi-brand comparison data in a visually compelling and professional format.
-
Slide Structure
Single-slide layout with nine 3D vertical bars arranged in three yearly groups (2025–2027), three circular callout shapes highlighting top-ranked brand percentages, and two color versions (crimson red and lime green) included in one file.
Related Products
-

Free Circular Emphasis Figure Donut Chart – Effective Data Presentation
#Free Graphs
-

Competitor Analysis and Market Trend Graph – Blue, Orange, Green Colors
#Free Graphs
-

Competitive Advantage Bar General Graph – Emphasizing Performance through Market Analysis
#Free Graphs
-

Market Analysis by Year Horizontal Bar Graph
#Free Graphs
