Business Promotion Strategy
Bundled Graph for Market Performance Analysis – Leveraging Competitive Advantage
RJ0600068_7
- Last Update 12/21/2025
- File Size 4.5MB
- # of Slides 2
- File Format PPTX
- Slide Ratio 16:9
- Color
Keywords
About the Product
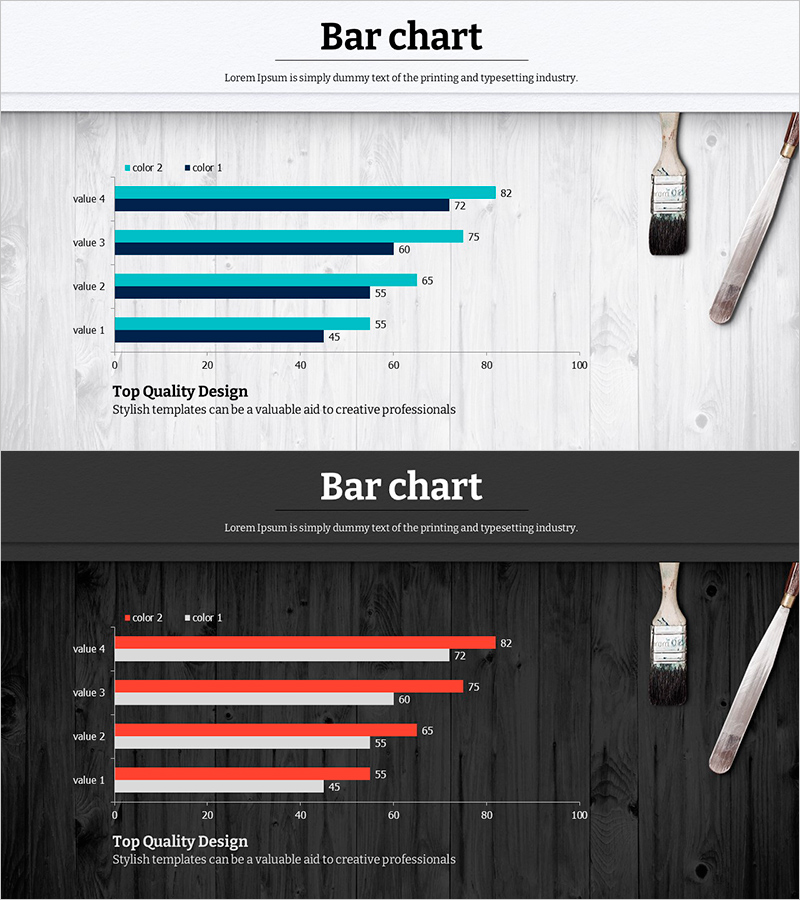
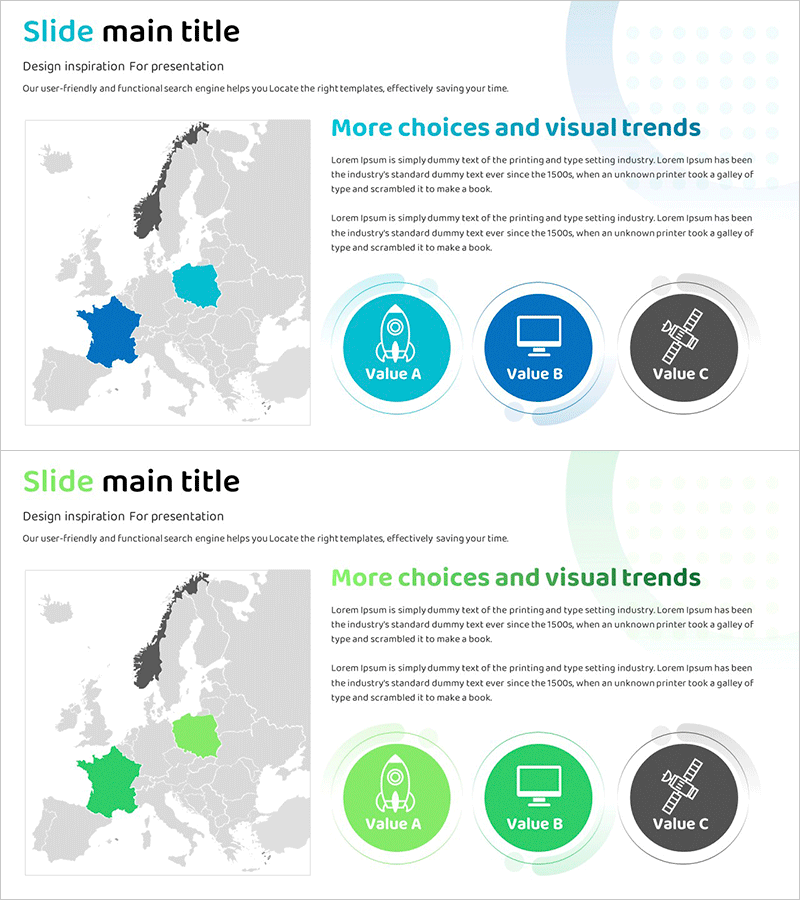
This slide features a bar chart designed to effectively analyze market performance. With an elegant design using blue and red colors, it provides clear comparisons with bundled data. Ideal for emphasizing business strategies and competitive advantages, it effectively showcases market analysis results at a glance. The template allows easy editing of text and colors, facilitating quick replacements of various elements. The editing difficulty is rated as easy, supporting swift user application in practical scenarios.
Related Products
-
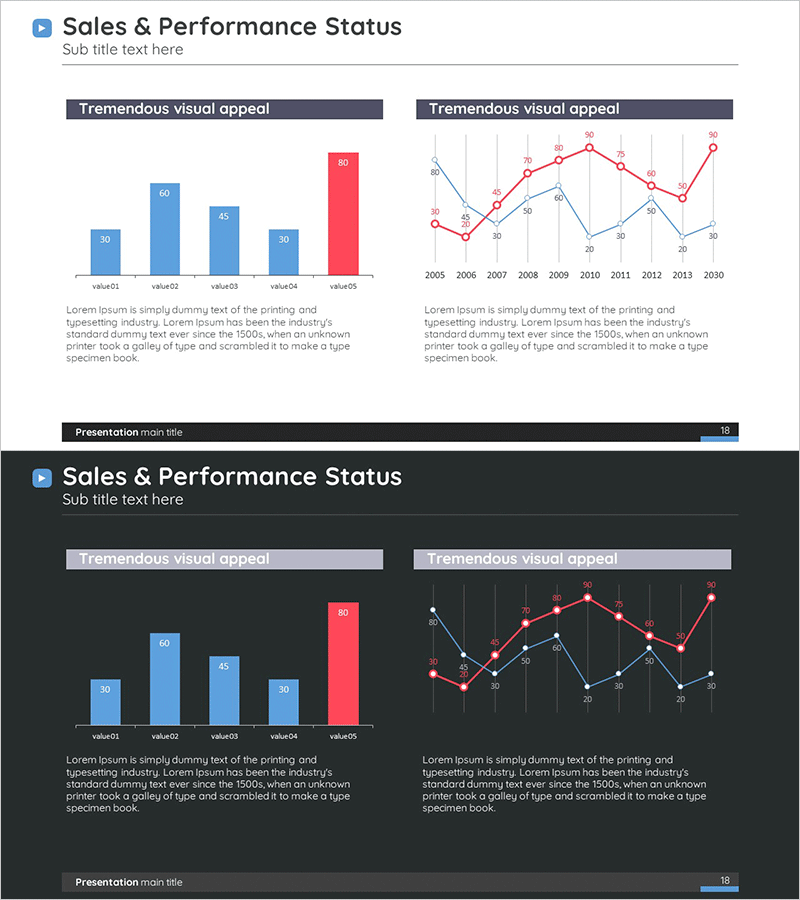
Key Performance Bar & Line Analysis Chart – Integrated Market Performance Visualization
#Company Introduction #Market and Competitor Analysis #Graph
-
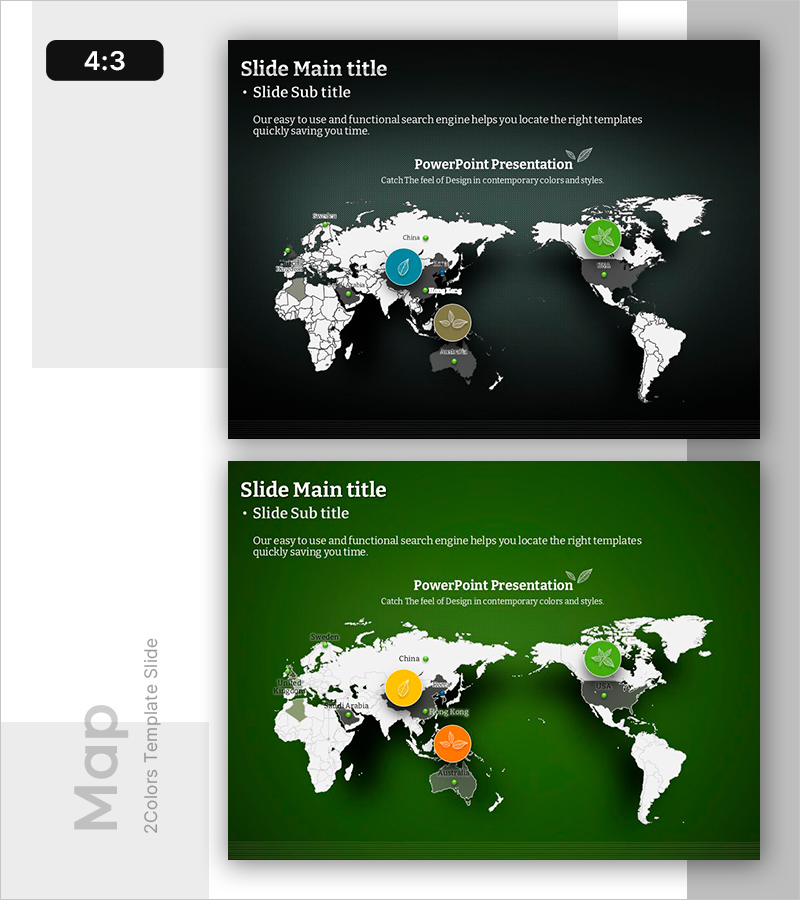
Tree PPT Global Map Plant Distribution Map
#Market and Competitor Analysis #Other #Market Analysis
-
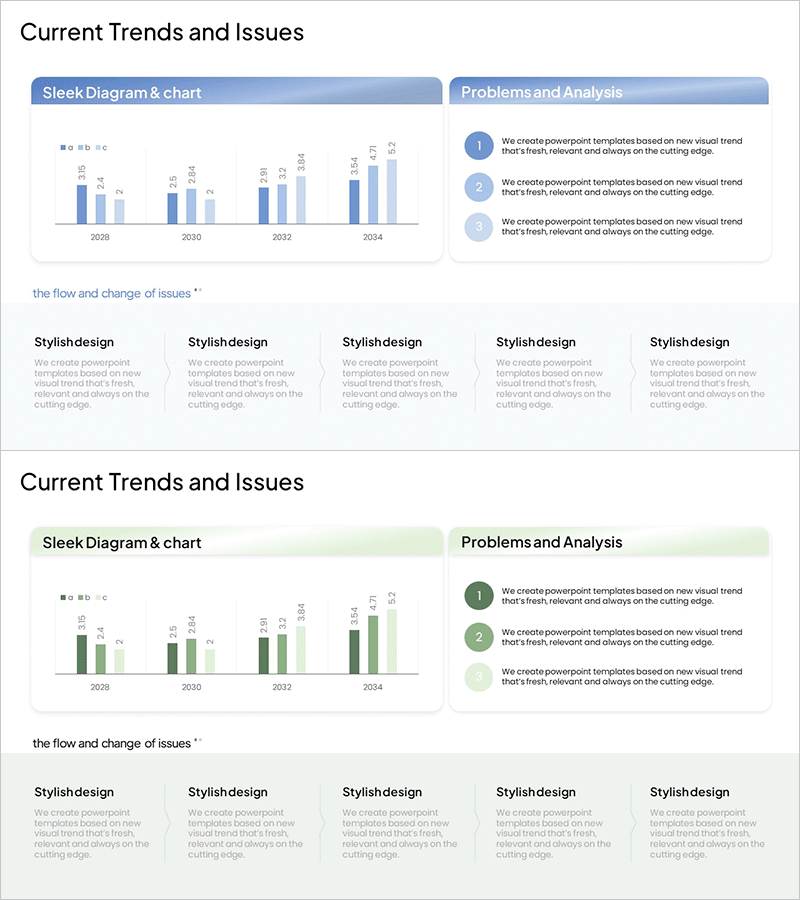
Current Trends and Issues Analysis Chart – Market and Competitor Analysis
#Market and Competitor Analysis #Diagram #Graph
-
Progress of the European Space Industry by Region Diagram
#Market and Competitor Analysis #Marketing Plan and Strategy #Diagram
