Progress of the European Space Industry by Region Diagram
RJ0700020_20
- Last Update 07/27/2025
- File Size 1.6MB
- # of Slides 2
- File Format PPTX
- Slide Ratio 16:9
- Color
Keywords
- #Content-Based Slides
- #Design-Based Slides
- #Market and Competitor Analysis
- #Marketing Plan and Strategy
- #Diagram
- #Other
- #Target Market
- #Target Market Strategy
- #Cluster
- #Closed Cluster Diagram
- #16:9
- #closed-form diagram PowerPoint
- #regional analysis slide template
- #world map presentation
- #industry progress diagram
- #geographic data visualization PPT
About the Product
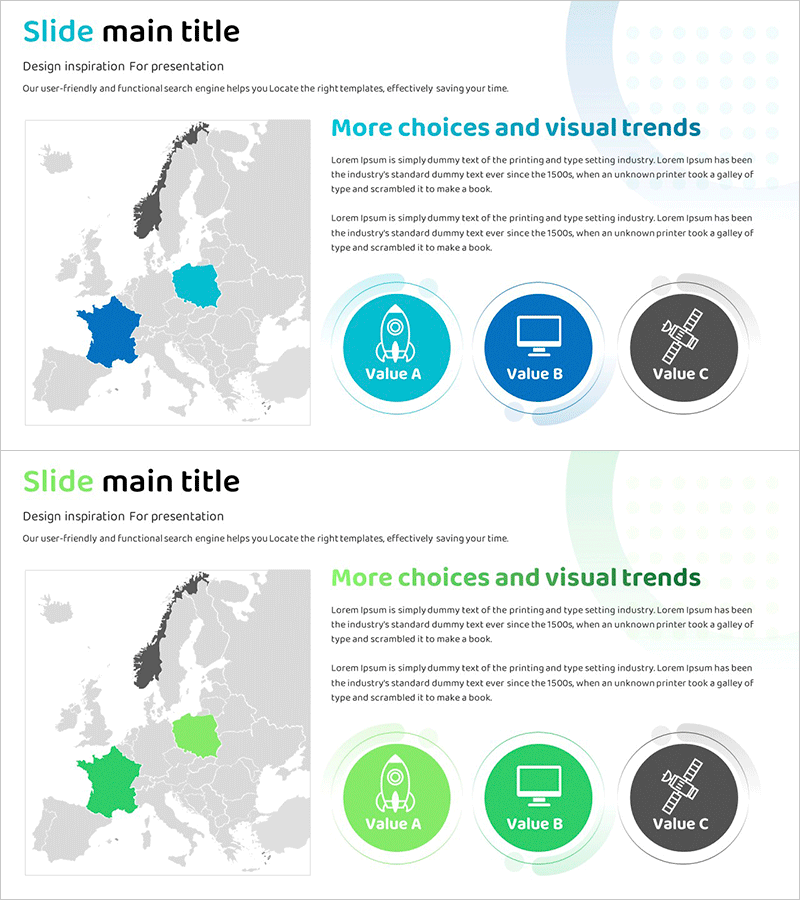
A PowerPoint slide visualizing the regional progress of the European space industry using a closed-form diagram structure. The world map highlights three key regions—France, Poland, and the United Kingdom—with each region's core value represented by circular icon nodes. Three color tones (cyan, blue, and gray) distinguish the nodes, which feature rocket, computer, and network icons to convey both geographic location and industry status simultaneously. The 2-slide set provides color variations (cyan and green) for flexible presentation theme selection. This slide deck is ready to use for market research, strategic analysis, and international business presentations.
Usage Points
-
Main Usage
Serves as a visual communication tool for international market research, regional industry status analysis, and strategic business presentations. The closed-form structure emphasizes each region's independent characteristics while maintaining overall context and comparative insights.
-
How to Use
Click highlighted regions on the world map background to input text and data, then edit the circular node icons and labels to represent key metrics for each region. Use the color variation slide to match your presentation theme or create visual contrast for emphasis.
-
Recommended For
Recommended for executives, marketing professionals, consultants, and researchers presenting international business strategies and market analysis. Particularly suited for space industry, energy, and manufacturing sectors requiring regional competitiveness assessment.
-
Slide Structure
Slide 1: Cyan-tone background with European world map (France, Poland, UK highlighted) and 3 circular nodes with rocket, computer, and network icons. Slide 2: Green-tone background with identical structure and color variation. Each node functions as an independent editable text and data input area.
Related Products
-

Analysis of Target Areas on the Korean Peninsula – Utilizing Cluster Diagram
#Market and Competitor Analysis #Marketing Plan and Strategy #Diagram
-

Analysis of US Target Regions – Strategic Marketing and Opportunities
#Market and Competitor Analysis #Marketing Plan and Strategy #Diagram
-

Rocket Launch Progress by Country – Systematic Data Presentation
#Market and Competitor Analysis #Marketing Plan and Strategy #Diagram
-

Setting Target Country Goals – Market Analysis and Strategy
#Market and Competitor Analysis #Marketing Plan and Strategy #Diagram
