Tree PPT Global Map Plant Distribution Map
RB0700011_7
- Last Update 03/15/2025
- File Size 2.1MB
- # of Slides 2
- File Format PPTX
- Slide Ratio 4:3
- Color
Keywords
About the Product
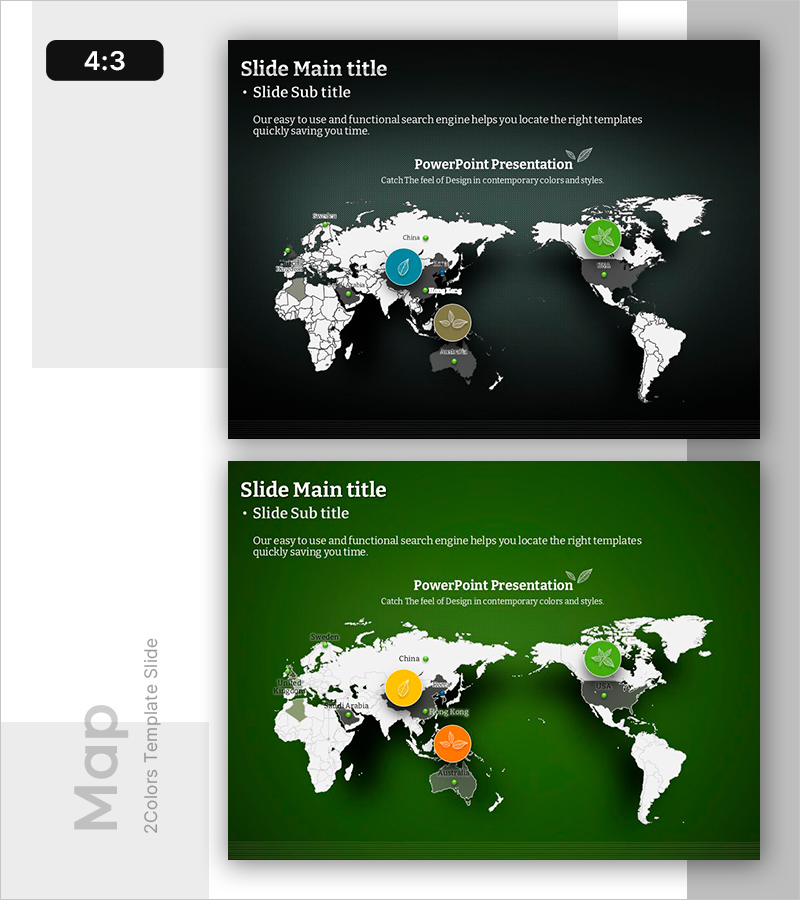
A world map PowerPoint slide designed to display plant distribution, market presence, or resource allocation across global regions using circular color-coded markers. Two background color versions—dark charcoal and forest green—are included to match your presentation theme. Each slide features a title section, subtitle, descriptive text area, and five strategically positioned circular icons on the world map for data annotation. Ideal for international business presentations, market expansion reports, competitive analysis, and global partnership discussions.
Usage Points
-
Main Usage
Visualize global market distribution, resource allocation, competitive positioning, or international network presence on a world map. Communicate market penetration, regional partnerships, supply chain locations, or competitor positions clearly to stakeholders and investors.
-
How to Use
Enter your presentation title and subtitle in the designated text areas at the top of the slide. Add regional data, company names, or market information to the five circular markers positioned on the world map. Select either the dark or green background version to align with your corporate branding and presentation style.
-
Recommended For
Global business strategy presentations, international market analysis reports, overseas branch or partner introductions, resource distribution overviews, competitive landscape analysis, investor pitches on global network expansion, and cross-border partnership discussions.
-
Slide Structure
Two-slide set, each featuring a title line, subtitle line, multi-line descriptive text area, a detailed world map graphic, and five color-coded circular markers with icons positioned across key global regions for data visualization.
Related Products
-

Simple Design Trend Wide PPT Map
#Market and Competitor Analysis #Marketing Plan and Strategy #Other
-

Simple Car Wide Presentation Map&Donut Chart – Market Share Analysis
#Market and Competitor Analysis #Graph #Other
-

Target Market Year-to-Year Comparison Analysis – Visualizing Market Trends
#Market and Competitor Analysis #Graph #Other
-

Map Graph on the Background of the Full Moon – Market and Competitor Analysis
#Market and Competitor Analysis #Graph #Other
