
Market and Competitor Analysis
Doughnut Chart for Office Worker Commuting Survey Results – Market Trends Visualization
RJ0600062_8
- Last Update 12/21/2025
- File Size 3.4MB
- # of Slides 2
- File Format PPTX
- Slide Ratio 16:9
- Color
Keywords
About the Product
This slide utilizes a doughnut chart to visually present the results of an office worker commuting survey, effectively communicating market trends and statistical data. The intuitive design is crafted for easy comprehension, accompanied by a lively color palette that enhances visual interest. Featuring green, teal, and orange colors, this chart is suitable for meeting materials, investor presentations, or research reports. It includes replaceable text and data areas with an editing difficulty rated as 'easy' for seamless customization.
Related Products
-
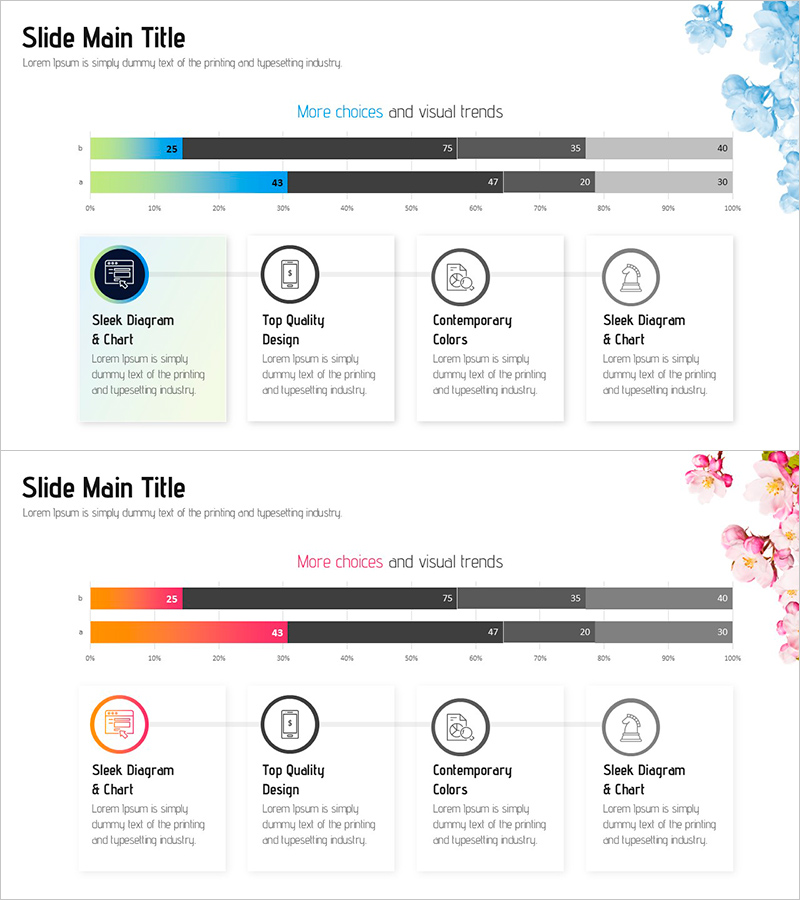
Sleek Diagram and Bar Graph for Systematic Data Strategy
#Operation Plan #Diagram #Graph
-
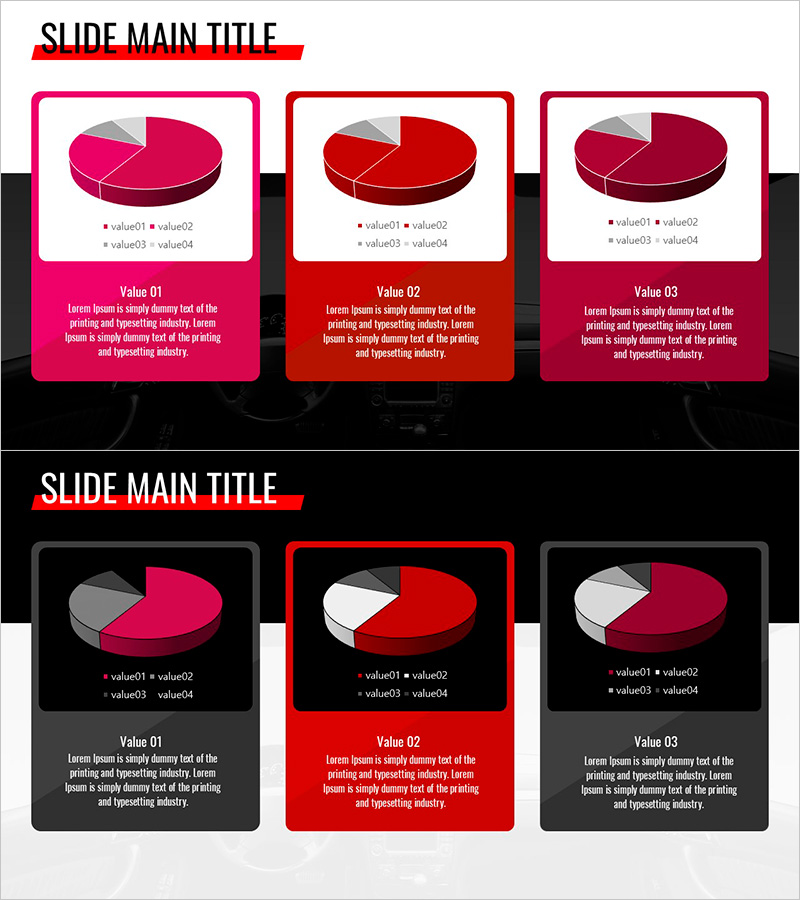
Simple Car Presentation Diagram & Pie Chart – Optimized for Market Analysis
#Market and Competitor Analysis #Diagram #Graph
-
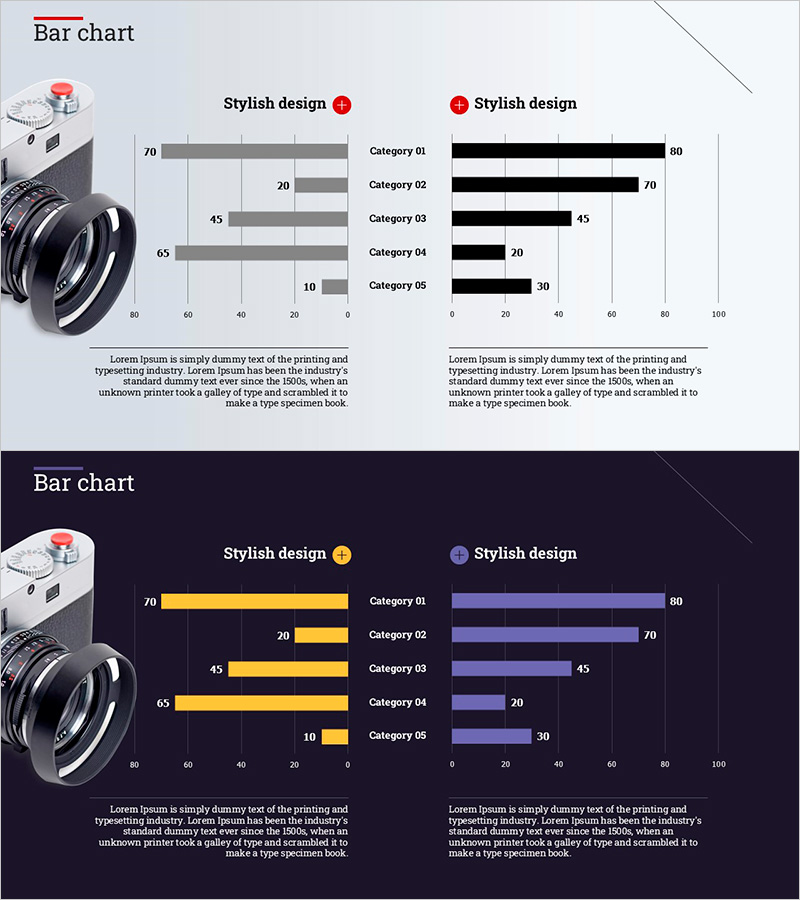
Camera Bar Graph Paired – Market Analysis and Competitive Edge
#Market and Competitor Analysis #Graph #Market Analysis
-
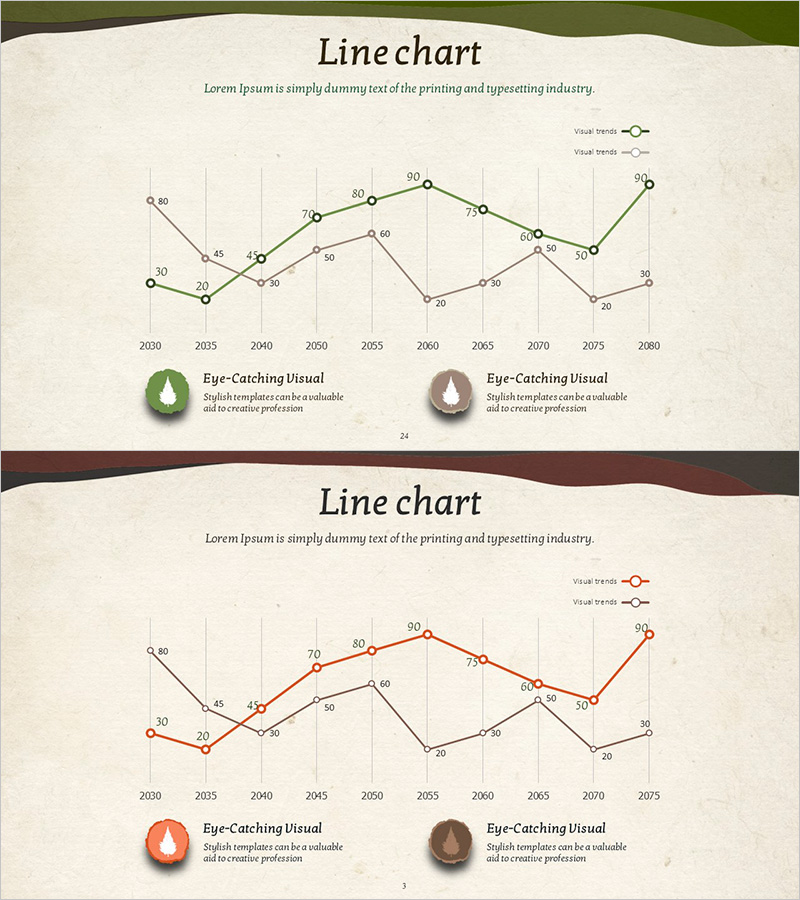
Analysis of Market Competitive Advantage of Animal Nature Conservation Program
#Market and Competitor Analysis #Graph #Competitive Advantage
