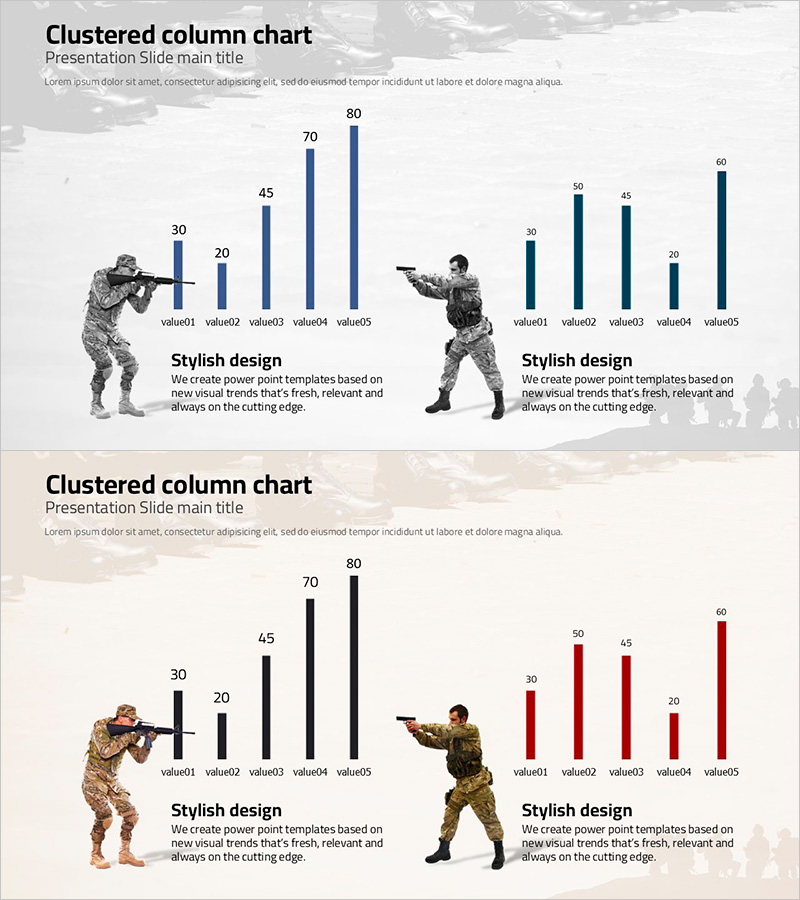
Market and Competitor Analysis
Graphs of Warring States – Capturing Competitive Advantages
RJ0600056_5
- Last Update 12/21/2025
- File Size 3.2MB
- # of Slides 2
- File Format PPTX
- Slide Ratio 16:9
- Color
Keywords
About the Product
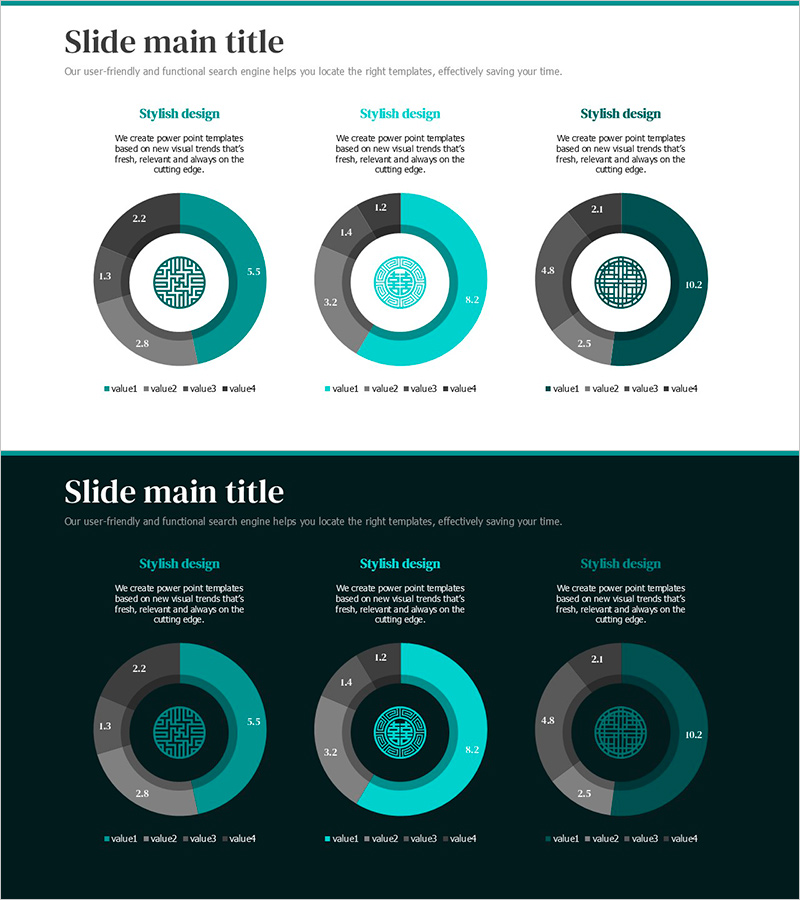
This PowerPoint template utilizes horizontal and vertical bar charts to visually represent the competitive advantages of warring states. The clean design, centered around military data, allows for a quick understanding of each competing country's status. With a modern and stylish approach, the use of blue and red enhances the tension and contributes to differentiated information delivery. This slide is perfect for military analysis reports, competitor analysis documents, and related presentations, featuring an easy-to-edit structure with a medium editing difficulty rating.
Related Products
-
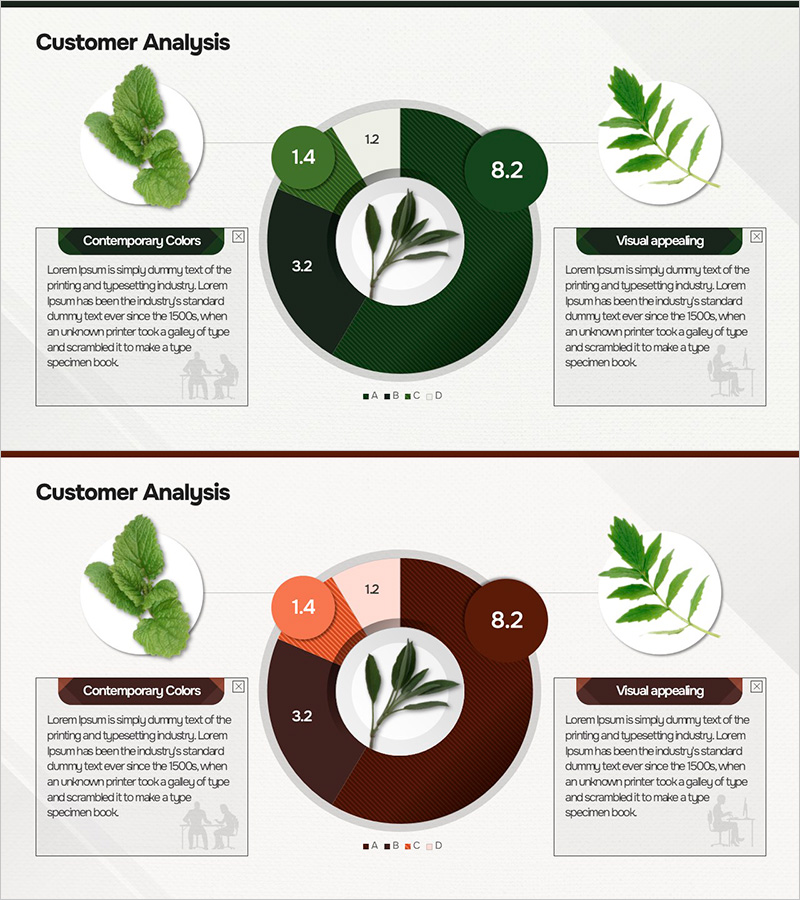
Market Status Analysis with Donut Chart – Attractive Colors
#Market and Competitor Analysis #Graph #Market Status
-
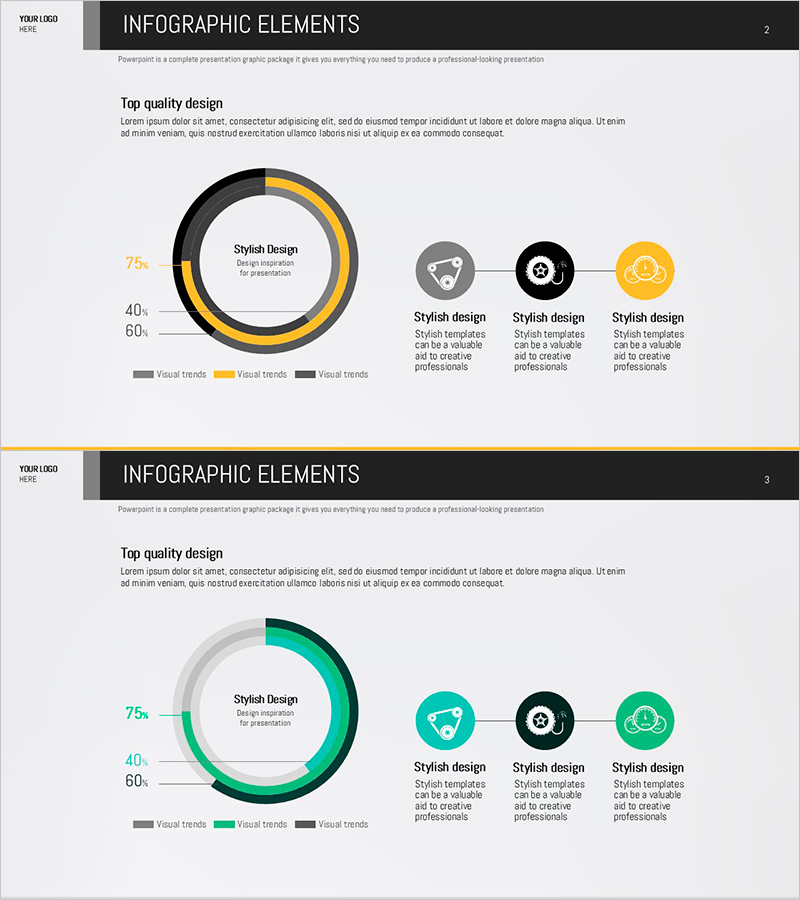
Status of Parts Production and Development – Donut Chart Infographic
#Product/Service #Business Introduction #Graph
-
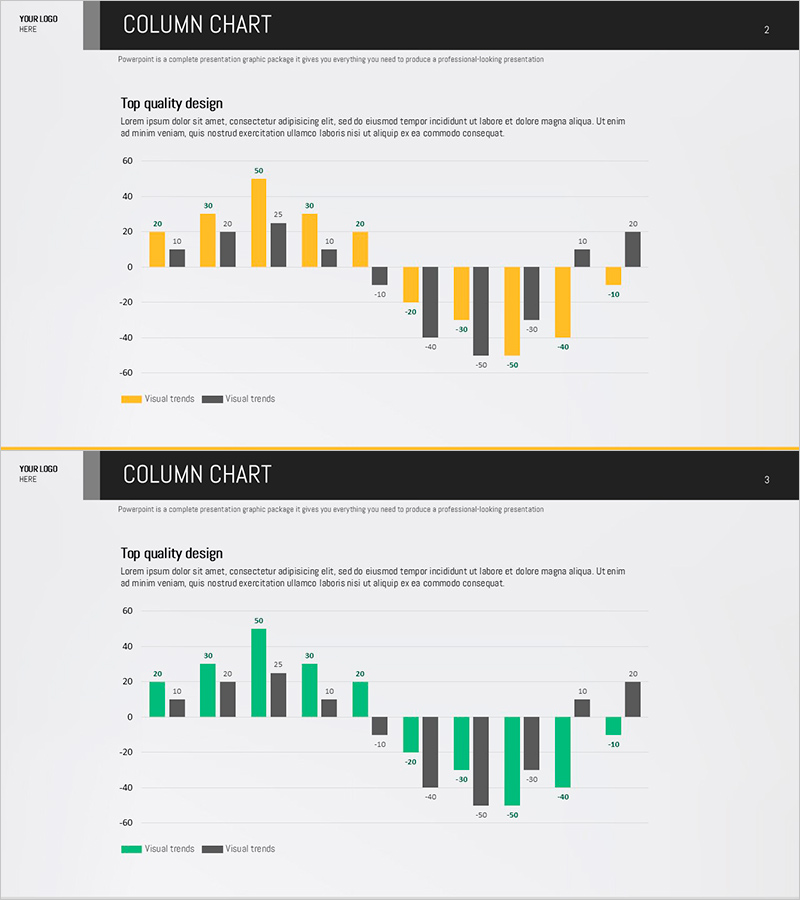
Yellow-Green Increase/Decrease Graph – The Essence of Data Visualization
#Graph
-
Visualization of Traditional Items Proportion – Market Share Analysis
#Company Introduction #Market and Competitor Analysis #Graph
