Yellow-Green Increase/Decrease Graph – The Essence of Data Visualization
RJ0600038_15
- Last Update 07/01/2025
- File Size 0.2MB
- # of Slides 2
- File Format PPTX
- Slide Ratio 16:9
- Color
Keywords
About the Product
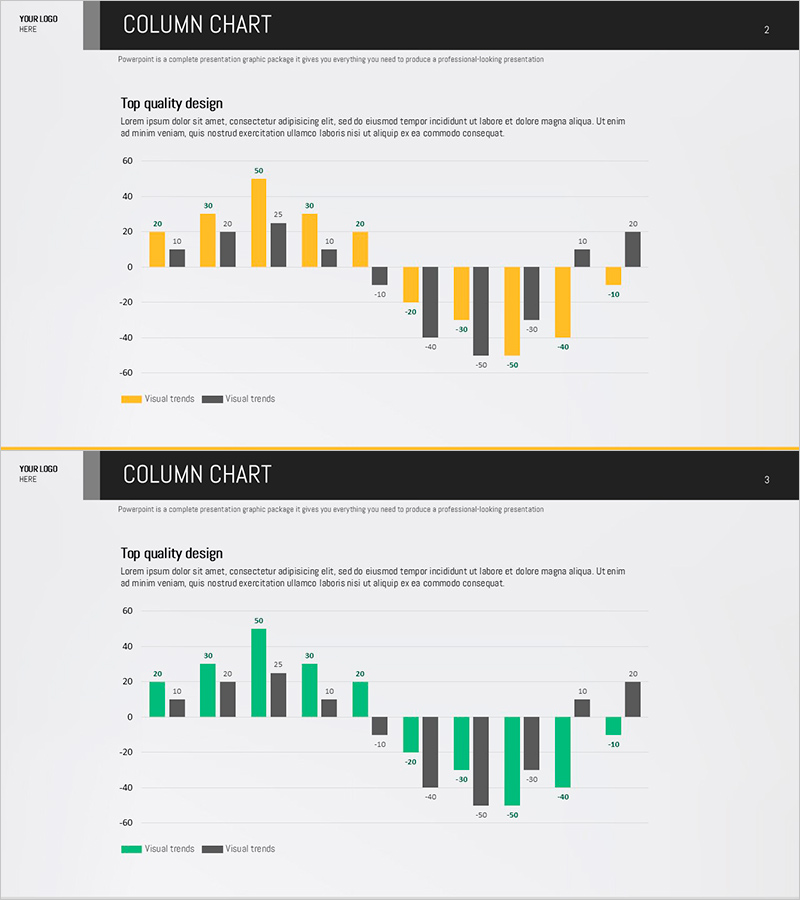
A vertical column chart PowerPoint slide featuring yellow and green dual-series data visualization for positive and negative values. This slide template is ideal for business reports, financial analysis, performance reviews, and quarterly results presentations. Each data point includes clear numerical labels for easy interpretation during presentations. The 16:9 widescreen format includes 2 fully editable slides in PPTX format, ready for immediate customization with your own data.
Usage Points
-
Main Usage
Visualize quarterly or monthly performance changes, revenue fluctuations, cost savings, and comparative metrics that include both positive and negative values. Designed for executive reports, performance analysis presentations, and financial status updates where dual-series data comparison is essential.
-
How to Use
Open the slide and input your data values directly into the chart. The graph updates automatically. Customize the legend labels and colors to match your specific metrics. Add your own title and descriptive text to align with your presentation context.
-
Recommended For
CFOs, financial managers, business unit directors, marketing managers, and project leaders who need to present quantitative performance data. Suitable for quarterly earnings presentations, budget execution reports, marketing campaign ROI analysis, and operational efficiency reviews.
-
Slide Structure
Both slides feature identical layout: title area + vertical column chart with approximately 10-12 data categories + dual-series legend (yellow and green). Positive values display above the axis while negative values appear below, enabling instant visual comparison of increases and decreases.
Related Products
-

Donut Chart by Gender in Old Age – Customer Analysis and Feedback
#Market and Competitor Analysis #Customer Success Stories #Graph
-

Visualizing Business Strategy with Line Chart – Risk Management and Strategic Approach
#Business Strategy #Risk Management and Regulatory Compliance #Graph
-

Pie Chart Composition Ratio Analysis – Market Status and Competitive Insights
#Market and Competitor Analysis #Graph #Market Status
-

User Analysis Graph by Age Group – Advanced Data Insights
#Market and Competitor Analysis #Diagram #Graph
