Graph
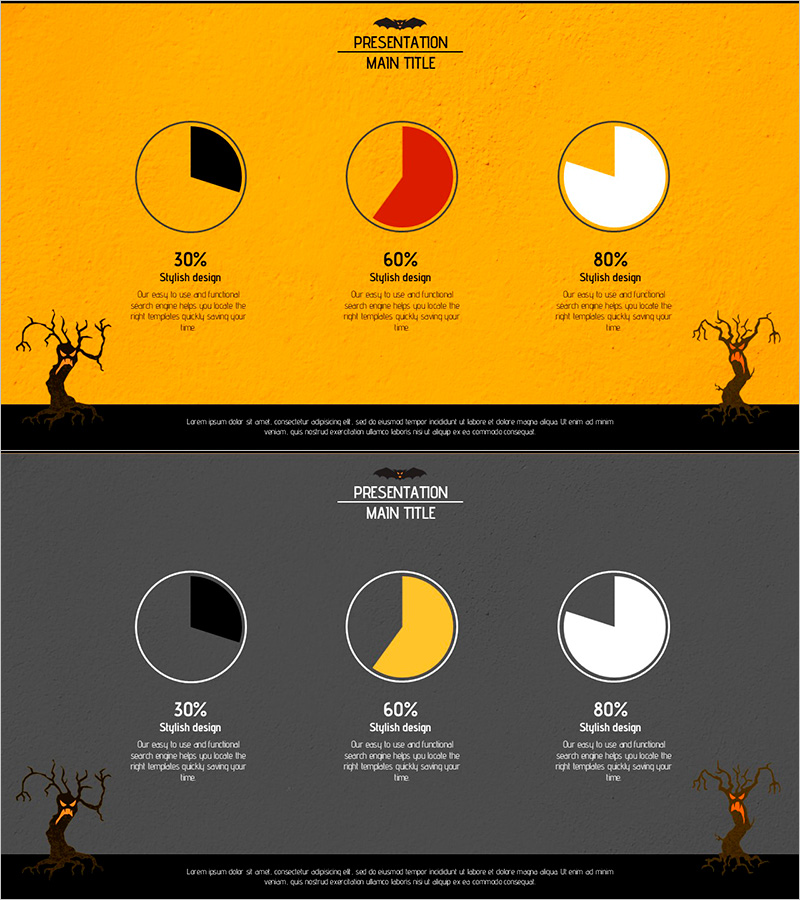
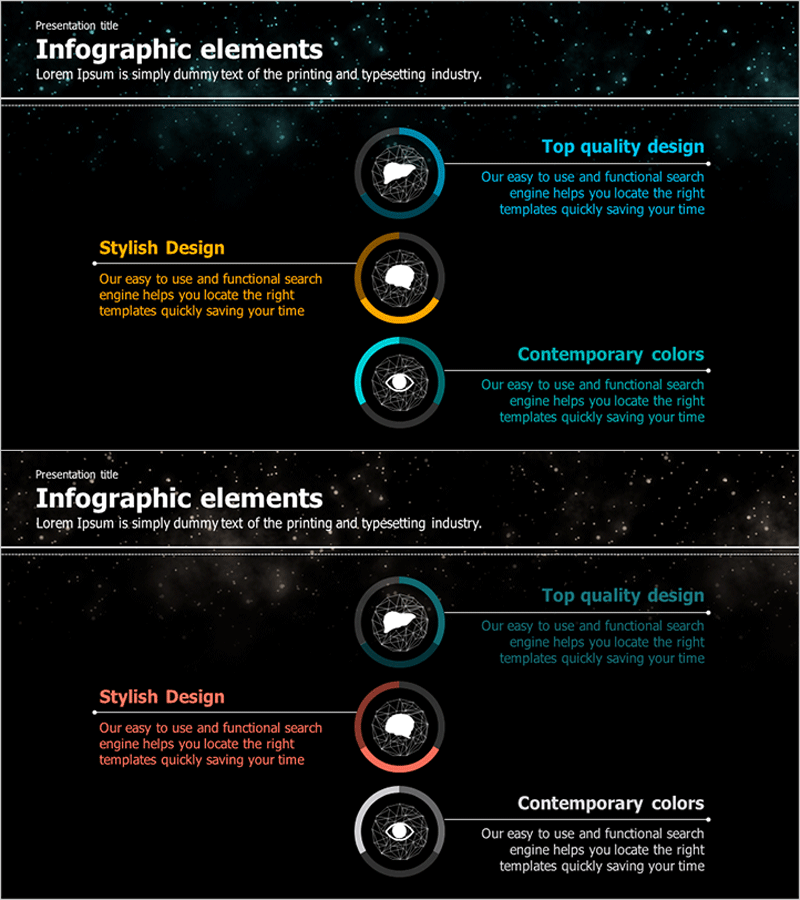
Visualizing Data with 3 Simple Pie Charts – A Stylish Presentation Method
RJ0600039_9
- Last Update 12/21/2025
- File Size 2.8MB
- # of Slides 2
- File Format PPTX
- Slide Ratio 16:9
- Color
About the Product
This slide utilizes three simple pie charts to intuitively convey data comparisons. The bright yellow background and varied pie chart colors capture attention during presentations, effectively highlighting each data point. This design is especially suitable for marketing reports and business performance presentations where data visualization is essential. The layout is straightforward for efficient information delivery, and replacing text and charts is straightforward, making the editing difficulty rated as 'easy'. It can be quickly adapted for various presentations, including business proposals.
Related Products
-
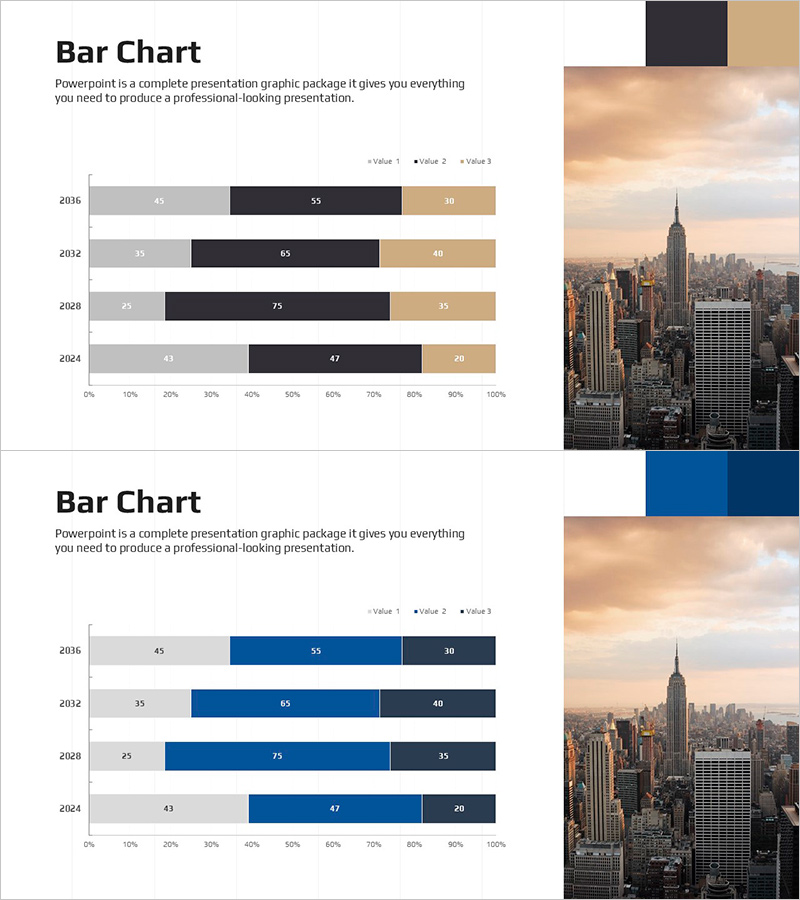
100% Cumulative Horizontal Bar Graph – Market Analysis
#Market and Competitor Analysis #Graph #Industry Trends
-
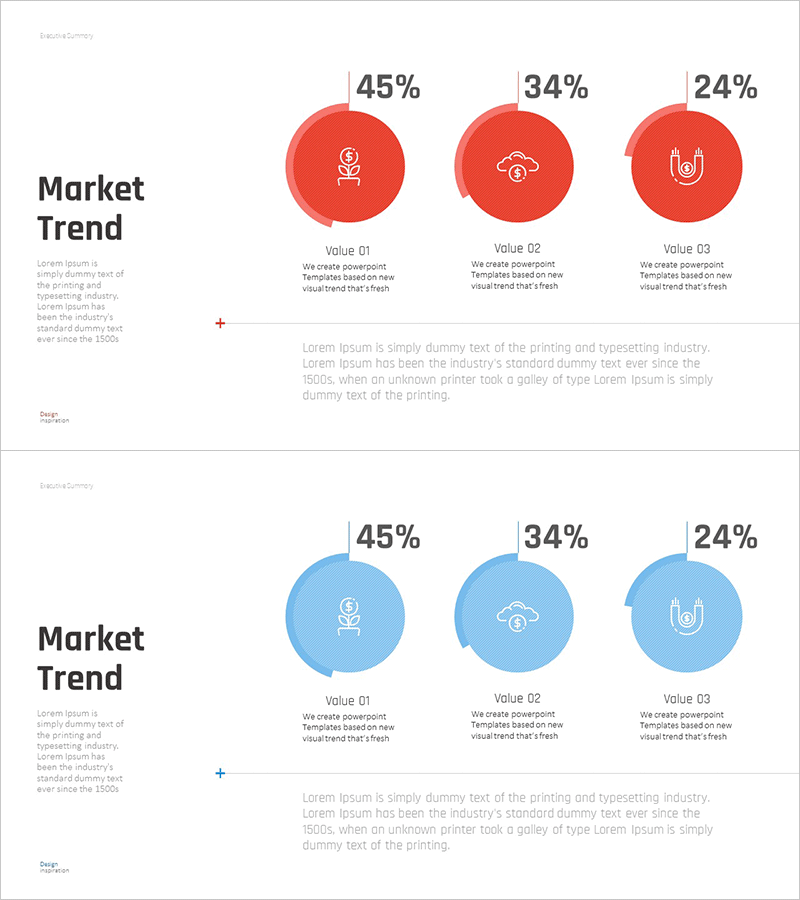
Market Trend Change Analysis Graph – Key Insights Visualization
#Product/Service #Market and Competitor Analysis #Graph
-
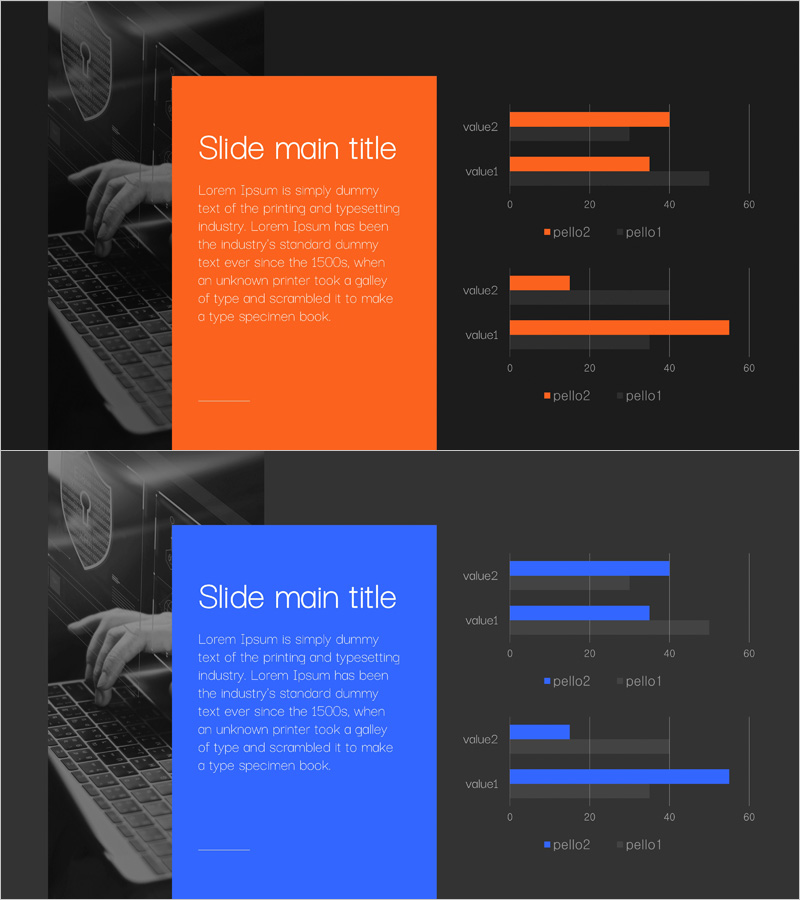
Cybersecurity Business Market Analysis Graph
#Market and Competitor Analysis #Graph #Competitor Analysis
-
Galaxy Theme Market Analysis Donut Circle Graph
#Market and Competitor Analysis #Graph #Market Analysis
