100% Cumulative Horizontal Bar Graph – Market Analysis
RJ0900031_28
- Last Update 08/25/2025
- File Size 2.5MB
- # of Slides 2
- File Format PPTX
- Slide Ratio 16:9
- Color
Keywords
- #Content-Based Slides
- #Design-Based Slides
- #Market and Competitor Analysis
- #Graph
- #Industry Trends
- #Horizontal Bar
- #Segmented Horizontal Bar
- #16:9
- #100% stacked horizontal bar chart PowerPoint
- #cumulative bar graph template
- #market analysis chart slide
- #data comparison PPT
- #percentage distribution bar chart
About the Product
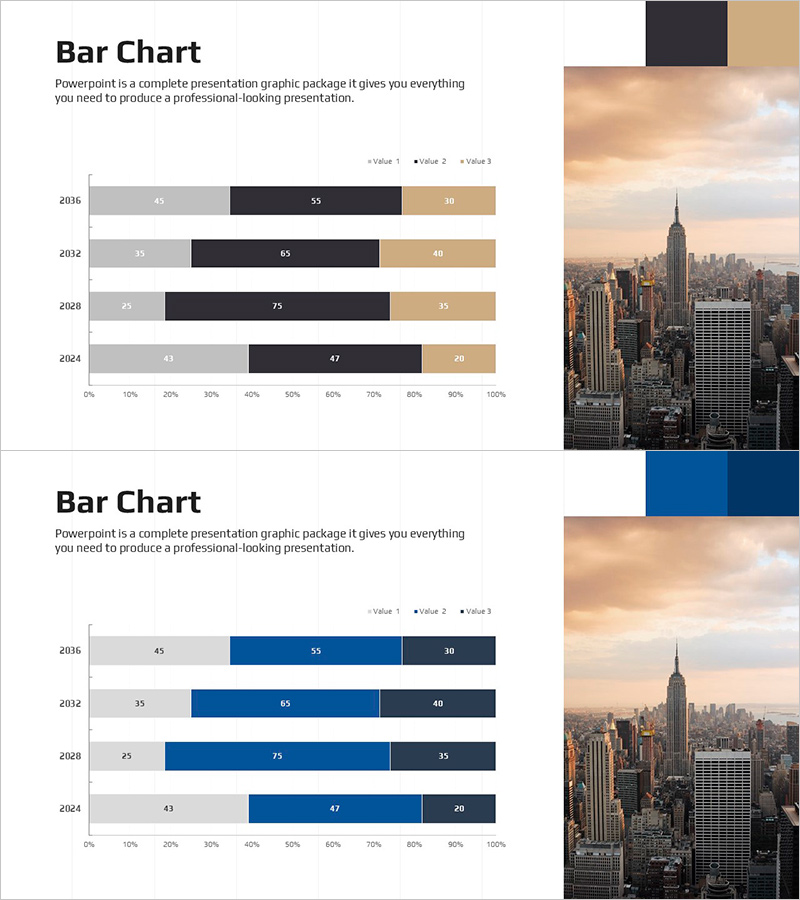
A professional 100% stacked horizontal bar chart PowerPoint slide designed for market analysis and comparative data visualization. The slide features three data series represented in gray, black, and beige colors, displaying year-over-year trends from 2016 to 2024. Each bar is normalized to a 0–100% scale, making it ideal for presenting market share, sales composition, customer segments, and competitive positioning. The layout clearly shows the proportion of each category relative to the whole, enabling stakeholders to quickly grasp market dynamics and strategic insights. Perfect for executive presentations, quarterly reports, investor pitches, and strategic planning documents.
Usage Points
-
Main Usage
Visualizes the relationship between parts and the whole using percentage-based stacked bars. Enables simultaneous comparison of multiple data series while clearly showing proportional changes over time. Ideal for presenting market share evolution, revenue composition, customer demographics, and competitive landscape to executives, investors, and stakeholders.
-
How to Use
Click on each bar to input your data values; the chart automatically recalculates percentages. Modify colors via the theme palette, update axis labels and legend text to match your document context. Duplicate rows or columns to add additional years or data series as needed.
-
Recommended For
Marketing, sales, finance, and executive teams presenting market analysis, competitive positioning, and revenue composition. Suitable for business plans, quarterly reports, investor relations presentations, marketing strategy documents, and product positioning materials.
-
Slide Structure
2-slide set. Each slide contains a title, descriptive text, and one 100% stacked horizontal bar chart. Charts display 4 years (2016, 2012, 2008, 2024) × 3 data series (gray, black, beige) with normalized 0–100% axis scale, legend, and complete formatting.
Related Products
-

Horizontal Bar Chart for Changes in the Climbing Population – Market Trend Analysis
#Market and Competitor Analysis #Graph #Industry Trends
-

World Travel Template Horizontal Bar Segment Chart
#Market and Competitor Analysis #Graph #Industry Trends
-

Bar Chart for Eco-friendly Practices Trends Visualization
#Market and Competitor Analysis #Graph #Industry Trends
-

Work and Home Life Graph – Market Trends and Design Sensibility
#Market and Competitor Analysis #Graph #Industry Trends
