Graph
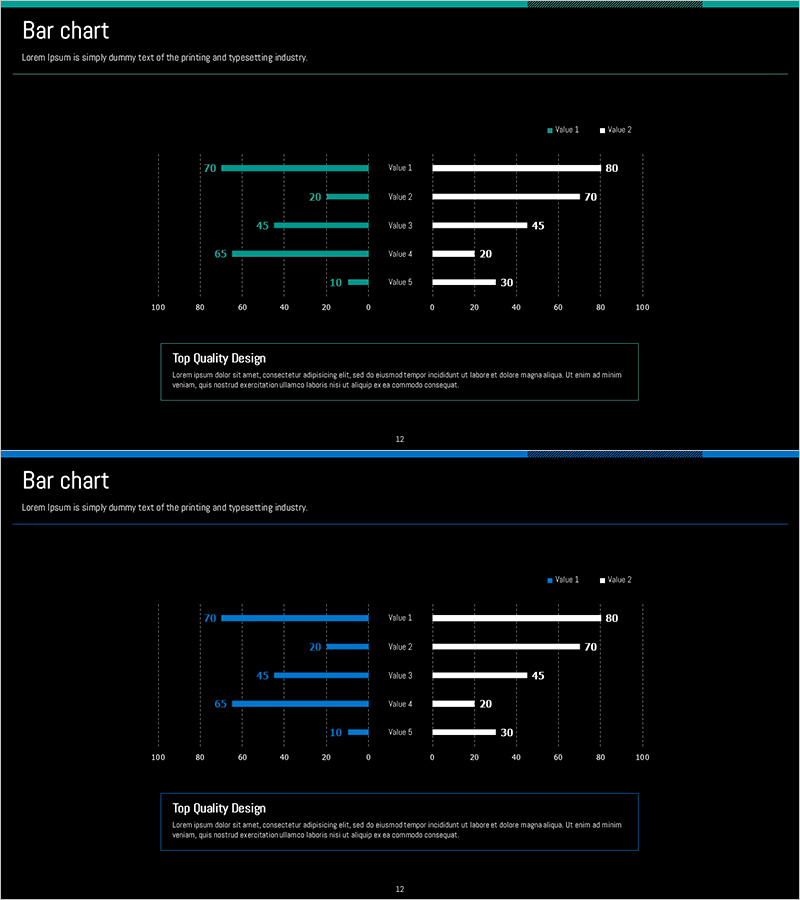
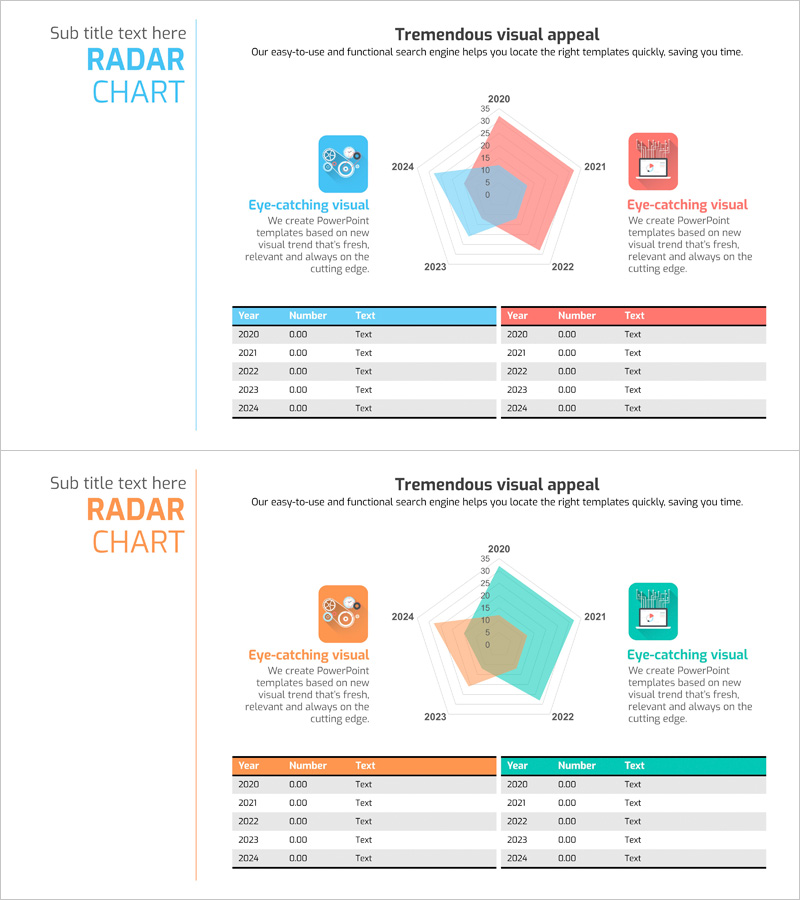
Two-Way Bar Chart – Essence of Data Analysis
RJ0600036_11
- Last Update 12/21/2025
- File Size 0.3MB
- # of Slides 2
- File Format PPTX
- Slide Ratio 16:9
- Color
Keywords
About the Product
This PowerPoint slide effectively uses a two-way bar chart optimized for comparing and analyzing values. The clean design featuring appealing green and blue colors provides a modern touch, set in a 16:9 aspect ratio. The comparison of each item is clearly presented, making it ideal for corporate presentations, reports, data analysis, and strategic planning. Users can easily replace text and data areas, with an overall editing difficulty rated as 'easy' for quick adaptability across various purposes.
Related Products
-
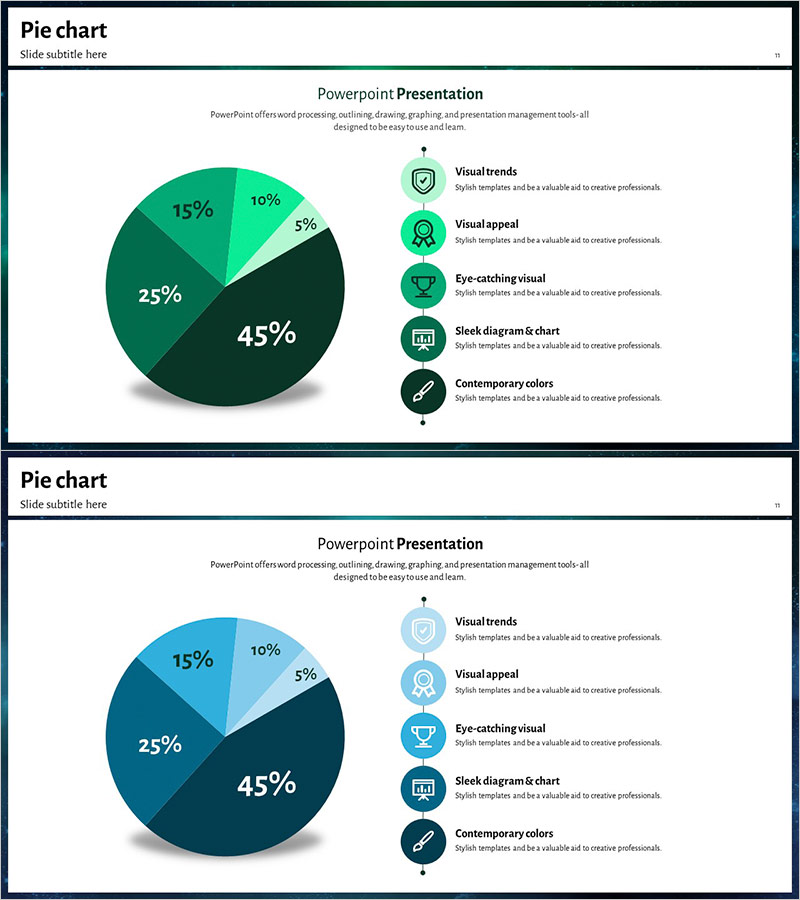
Market Analysis and Market Share Pie Chart – Capturing Success Through Data Visualization
#Market and Competitor Analysis #Diagram #Graph
-
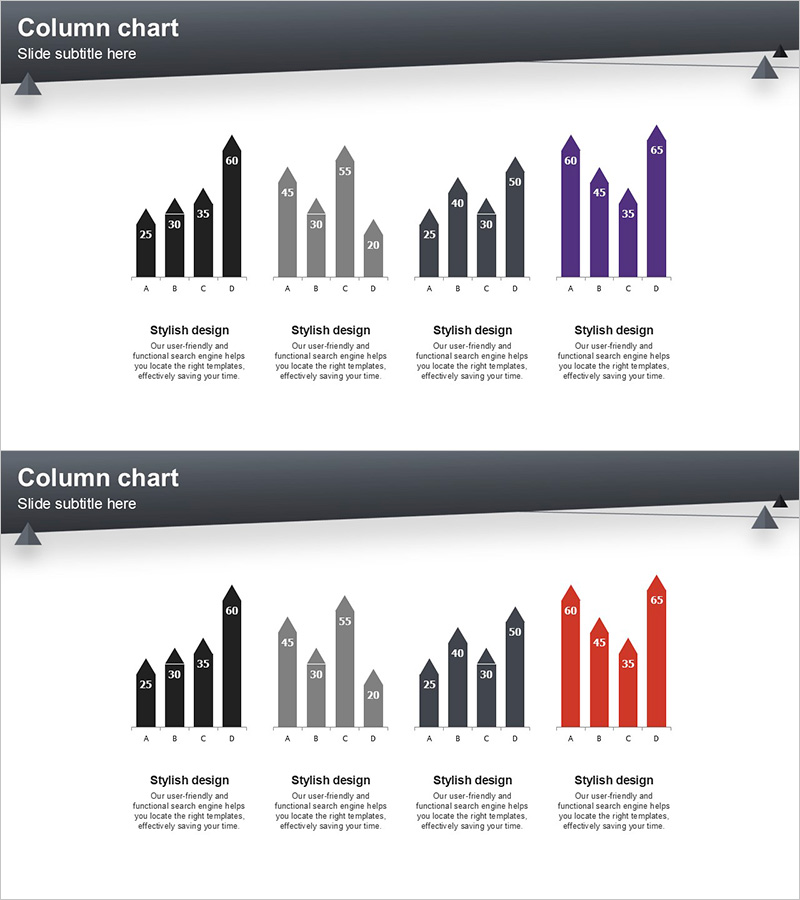
Layout Design Presentation Template - Column Charts
#Market and Competitor Analysis #Graph #Competitor Analysis
-
Competitive Strengths Comparison Chart – An Effective Market Analysis Tool
#Product/Service #Market and Competitor Analysis #Diagram
-
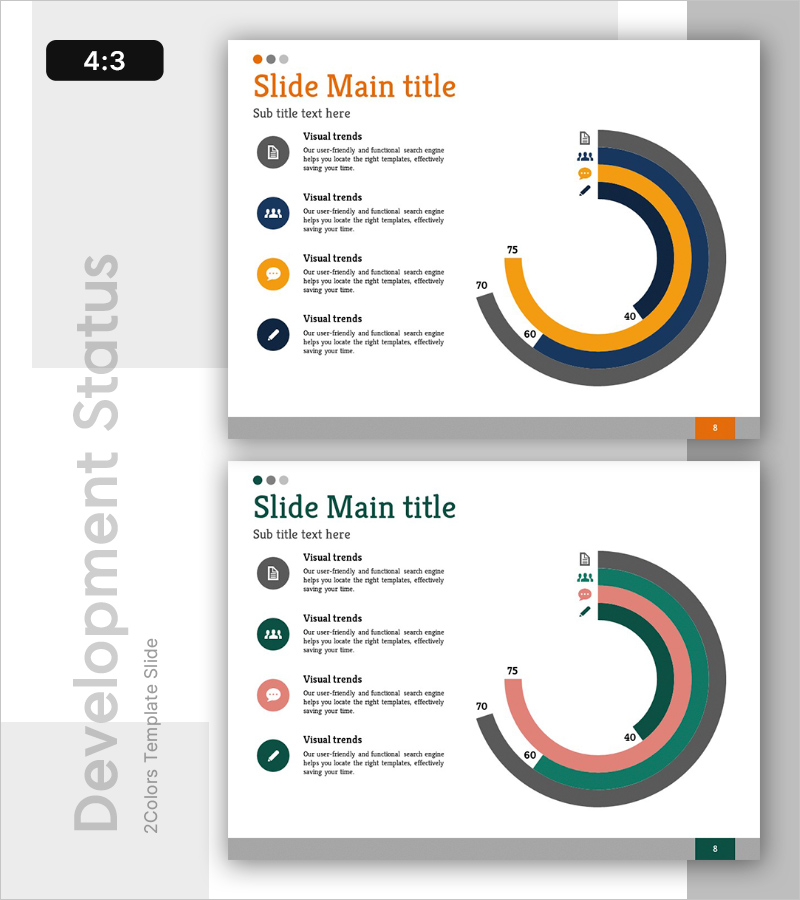
Big Data Development Status Radial Graph – Captivating Visual Appeal
#Product/Service #Business Introduction #Diagram
