Graph
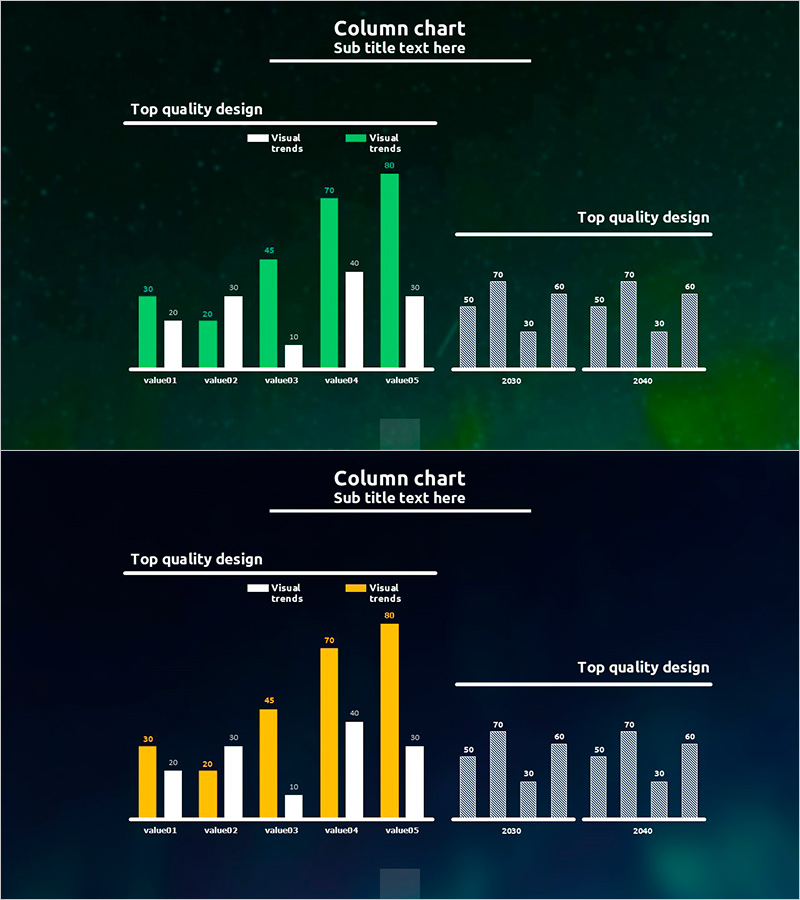
Bar Graph for Camping Competitor Survey
RJ0600032_11
- Last Update 12/21/2025
- File Size 0.8MB
- # of Slides 2
- File Format PPTX
- Slide Ratio 16:9
- Color
Keywords
About the Product
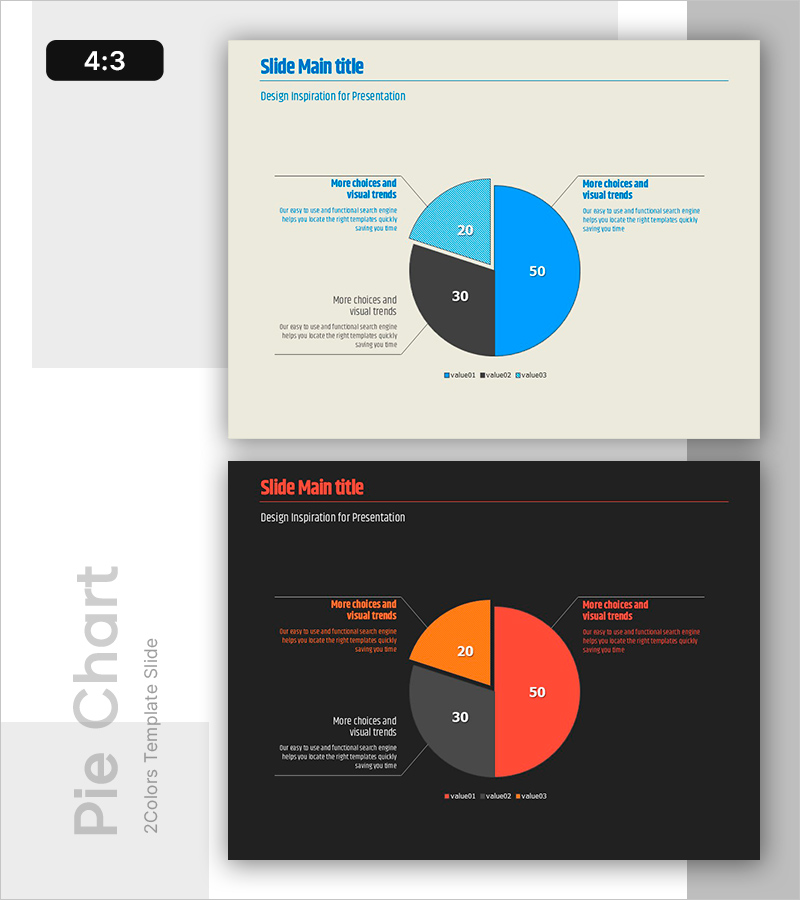
This slide features a bar graph that visually represents the competitor survey in the camping industry. Utilizing blue, green, and yellow colors, it effectively conveys the subject matter. With a clear layout, the graph facilitates easy comparisons of performance across different competitors, making it suited for market analysis, marketing plans, and competitiveness assessments. Ideal for business presentations, special reports, and proposals, this slide allows for straightforward text and data replacements, enhancing editing efficiency.
Related Products
-
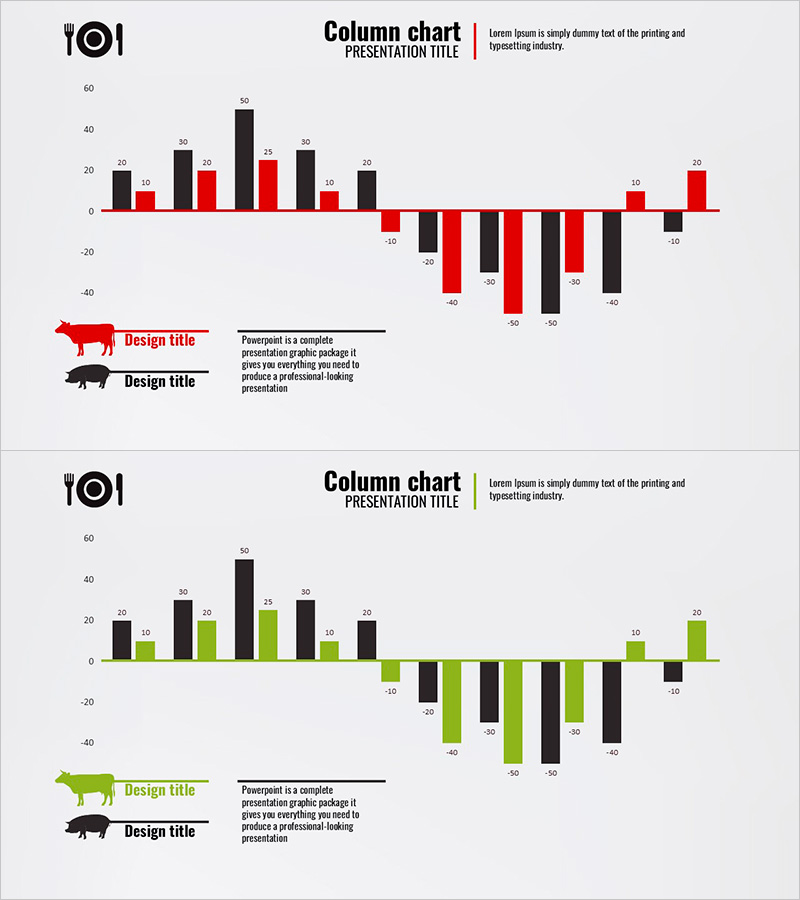
Graph of Increase/Decrease in Meat Consumption – Market Analysis and Competitive Advantage
#Market and Competitor Analysis #Financial Plans and Performance #Graph
-
Time Usage by Work Area – Market Analysis
#Market and Competitor Analysis #Diagram #Graph
-
Graph Slide Visualizing Changes in Divorce Numbers
#Market and Competitor Analysis #Graph #Text Box
-
Pie Chart for Market Share Analysis – Data Visualization
#Market and Competitor Analysis #Graph #Market Status
