Market and Competitor Analysis
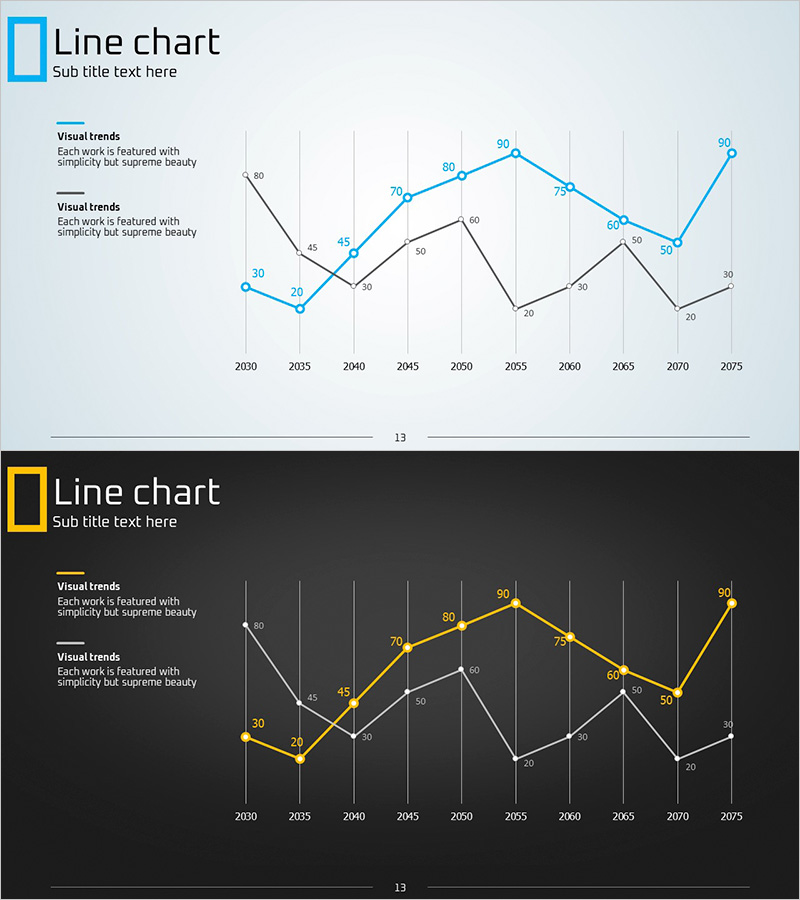
Blue Yellow Line Graph – Market and Competitive Analysis
RJ0600026_12
- Last Update 12/21/2025
- File Size 0.3MB
- # of Slides 2
- File Format PPTX
- Slide Ratio 16:9
- Color
Keywords
About the Product
This slide features a blue-yellow colored line graph template designed for effectively visualizing market trends. It combines simplicity and clarity, making it ideal for presenting changes over time through easy comparison of data. The harmonious blend of blue and yellow provides a strong visual impact even on dark backgrounds. This slide is perfect for market and competitive analysis, ensuring effective communication of data changes, whether in investor presentations or strategic discussions. With an editing difficulty rated as easy, it offers easily replaceable text and graph elements, allowing users to modify it to fit their specific needs.
Related Products
-
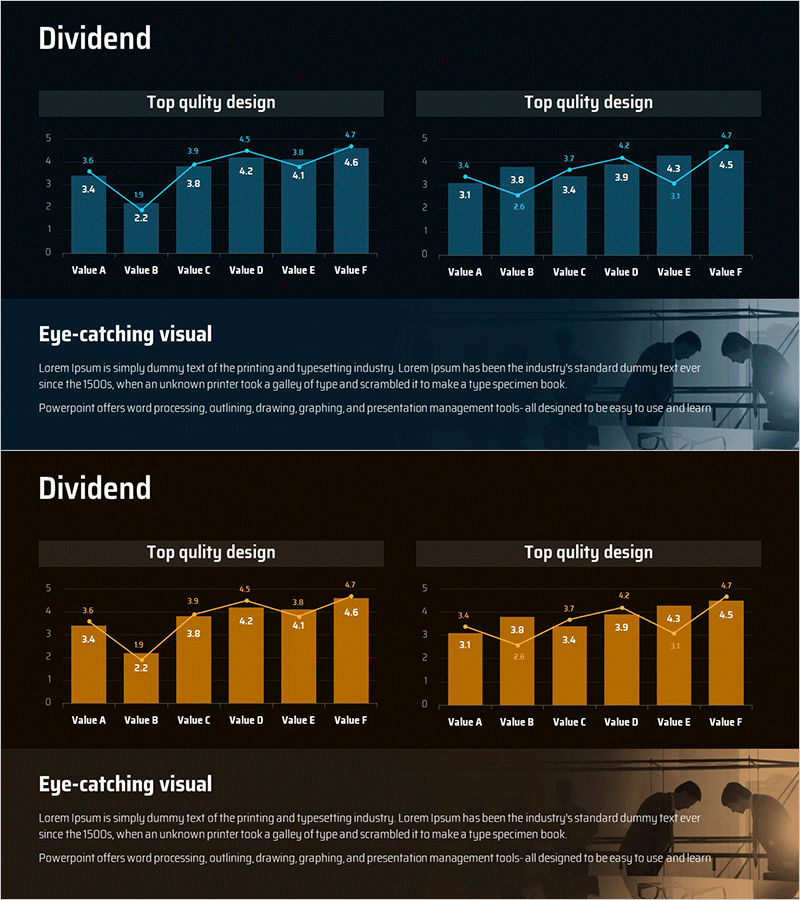
Dividend Yield Comparison Analysis Chart – Visualizing Investment Performance
#Market and Competitor Analysis #Financial Plans and Performance #Graph
-
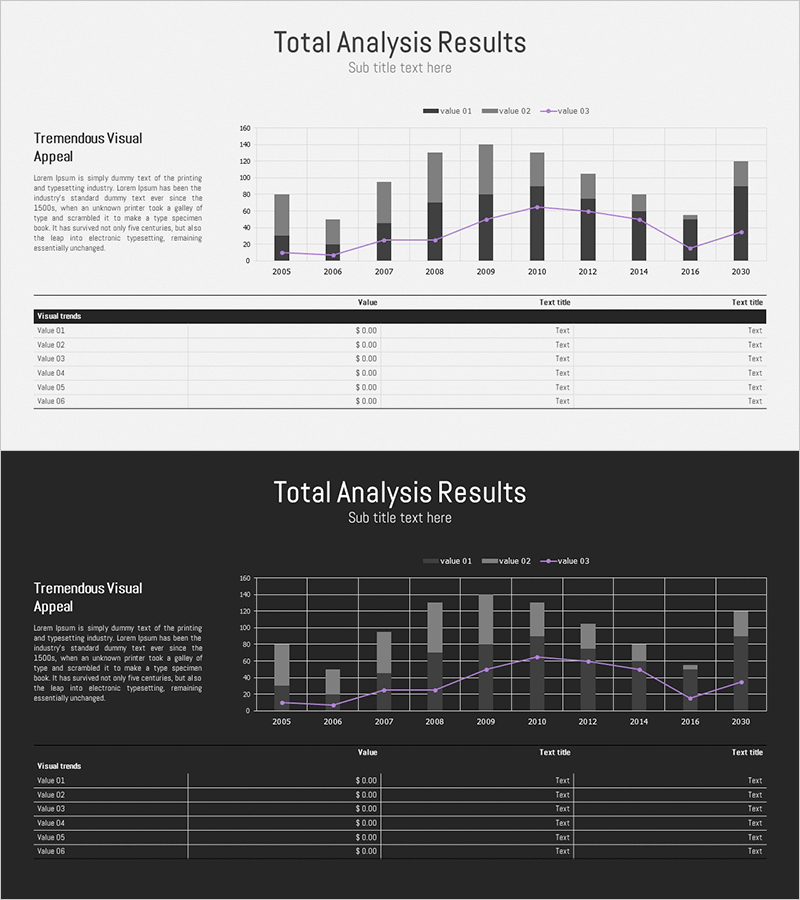
Business Profit Analysis Results – Visualization of Market and Customer Feedback
#Market and Competitor Analysis #Customer Success Stories #Diagram
-

Online Shopping Mall Composition Analysis Graph - Business Analysis and Technical Insights
#Business Introduction #Market and Competitor Analysis #Graph
-

Orange Green Achievement Graph – Visualizing Goal Attainment
#Business Promotion Strategy #Market and Competitor Analysis #Graph
