Graph
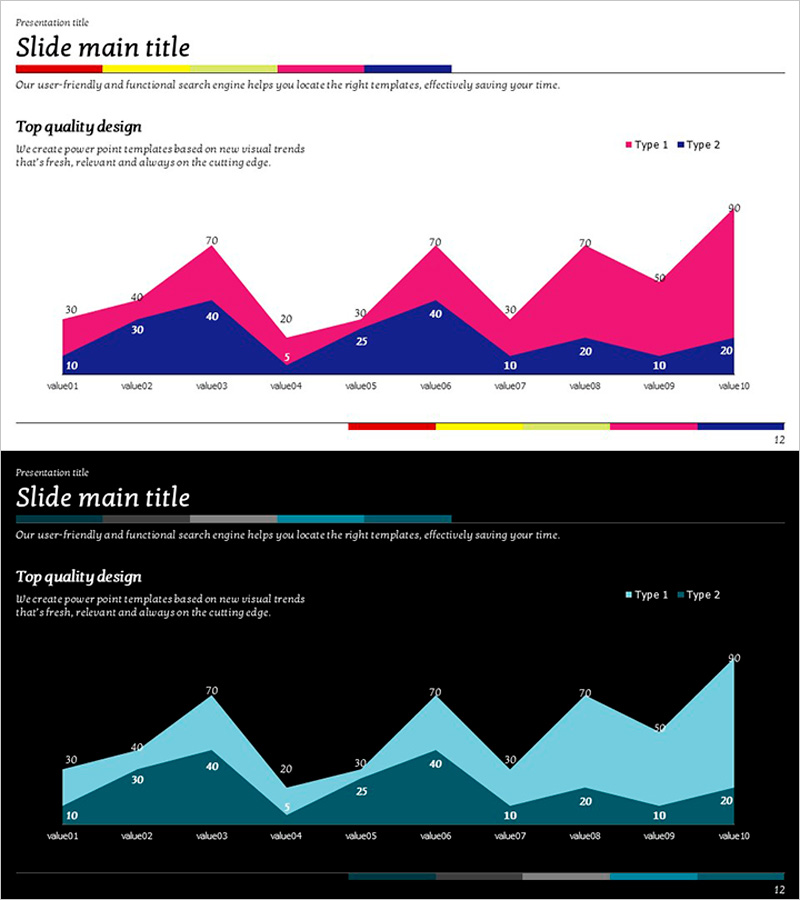
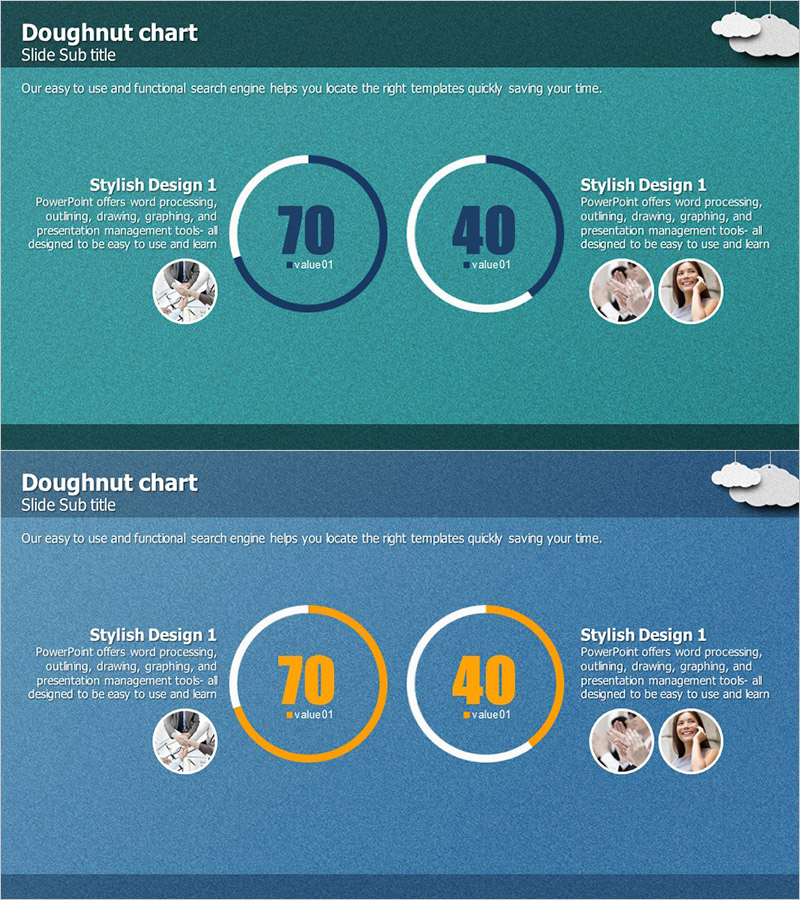
Visualizing Data with Current Status Area Graph
RJ0600008_11
- Last Update 12/21/2025
- File Size 0.1MB
- # of Slides 2
- File Format PPTX
- Slide Ratio 16:9
- Color
About the Product
This slide features dual area graphs that visually compare various datasets. With distinct colors distinguishing two types of data, information transmission is effectively achieved. The graph is designed in an aesthetically pleasing layout, making key information easy to read. It is particularly suitable for business meetings, annual reports, or data analysis materials. The slide facilitates easy replacement of text and data elements, rated with an overall editing difficulty of 'easy'.
Related Products
-
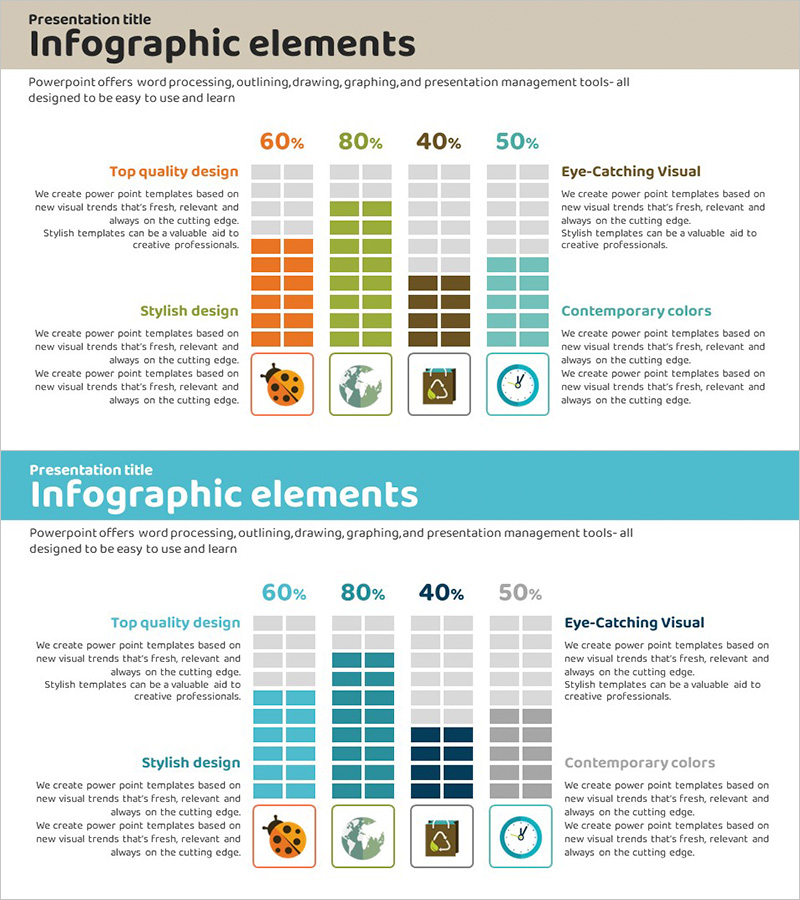
Carbon Neutral Infographic Eco-Friendly Battery Chart – Modern Technology and Sustainability
#Product/Service #Business Introduction #Graph
-
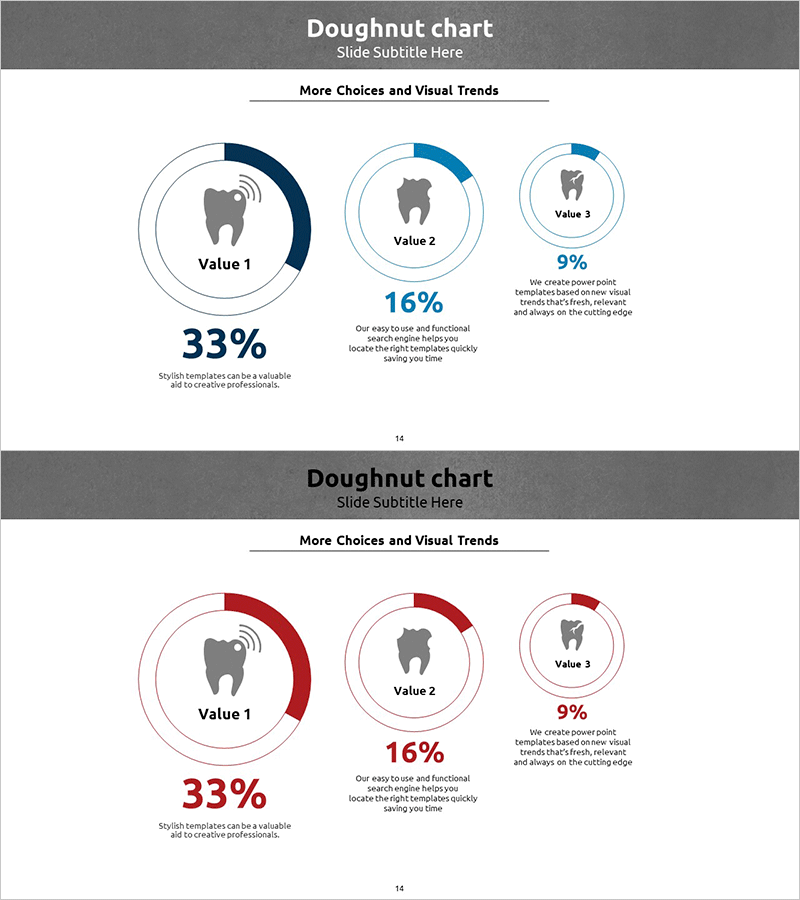
Donut Graph by Caries Erosion Status – Essential for Market Analysis
#Business Introduction #Market and Competitor Analysis #Graph
-
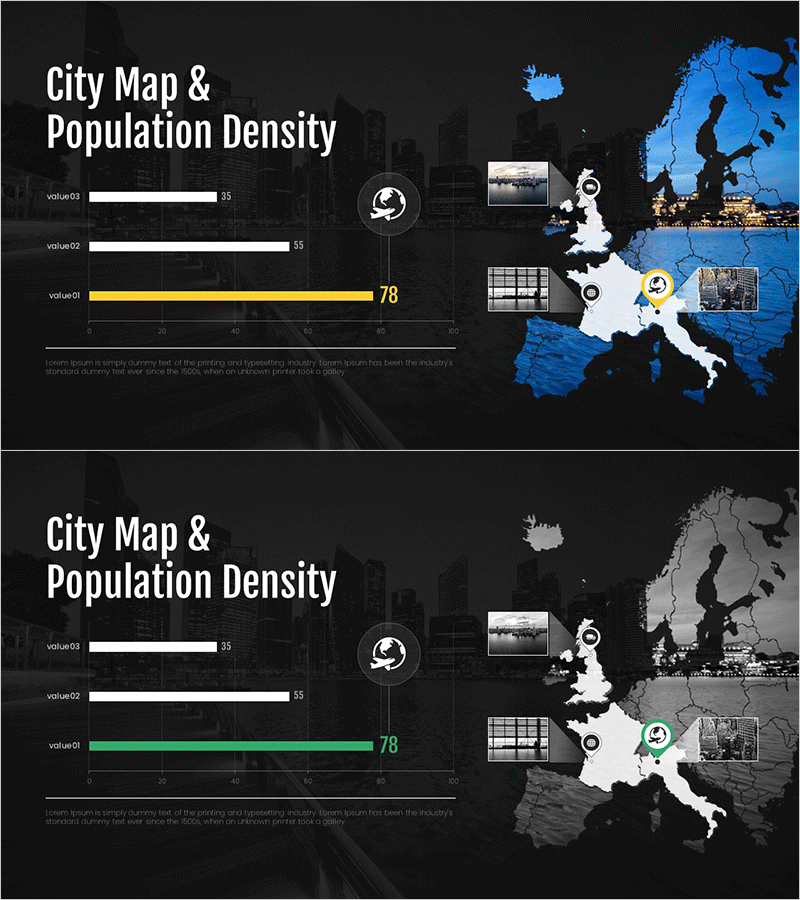
City Map & Population Density Insights Slide – Market and Competitive Analysis
#Market and Competitor Analysis #Graph #Other
-
Key Market Analysis Donut Chart – Market Share Visualization
#Market and Competitor Analysis #Graph #Market Share
