Market and Competitor Analysis
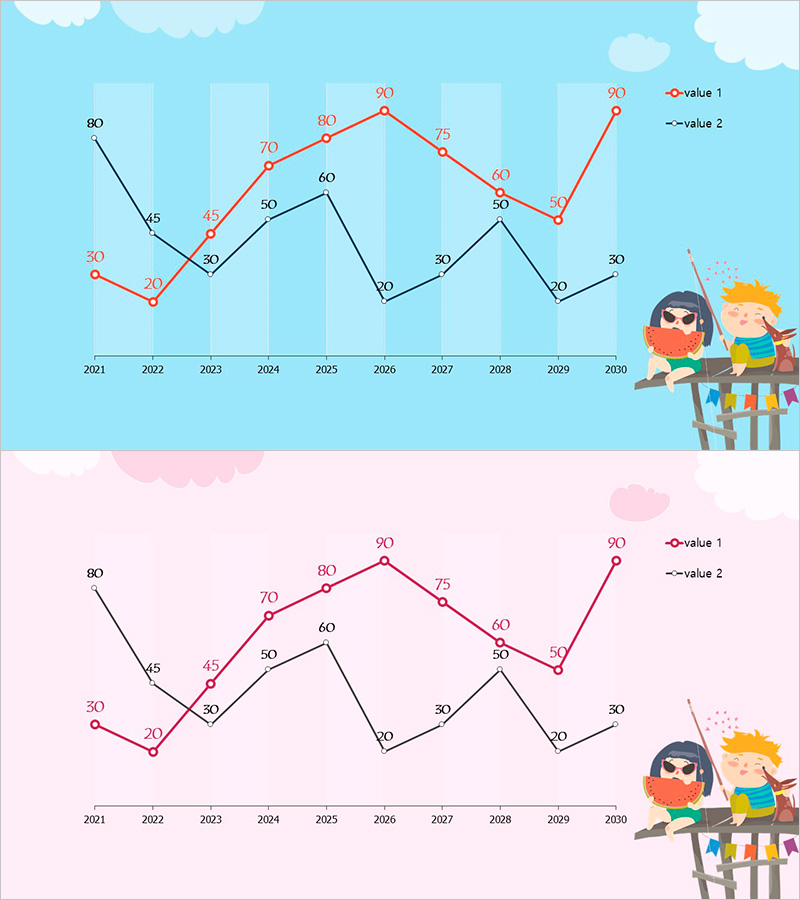
Summer Vacation Template Bent Line Graph
RJ0500046_22
- Last Update 12/21/2025
- File Size 0.3MB
- # of Slides 2
- File Format PPTX
- Slide Ratio 16:9
- Color
Keywords
About the Product
This slide features a bent line graph representing summer vacation data from 2021 to 2030, visually illustrating market changes. The cute illustrations of children combined with a soft blue and red background create a fun atmosphere. This template is suitable for effective communication of market and competitive analysis, as well as future prospects, clearly showing data trends. The sample data can be adapted to various real-world data, with an editing difficulty rated as 'easy'.
Related Products
-
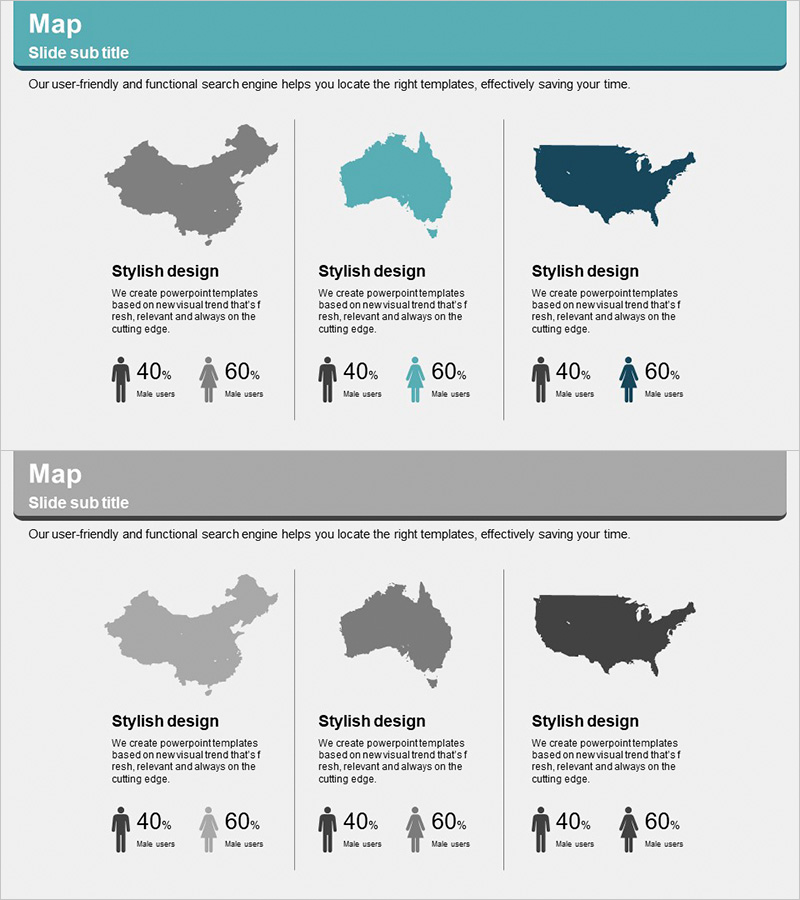
Diagram of User Gender Ratio by Country - Market and Customer Insights
#Market and Competitor Analysis #Other #Customer Analysis
-
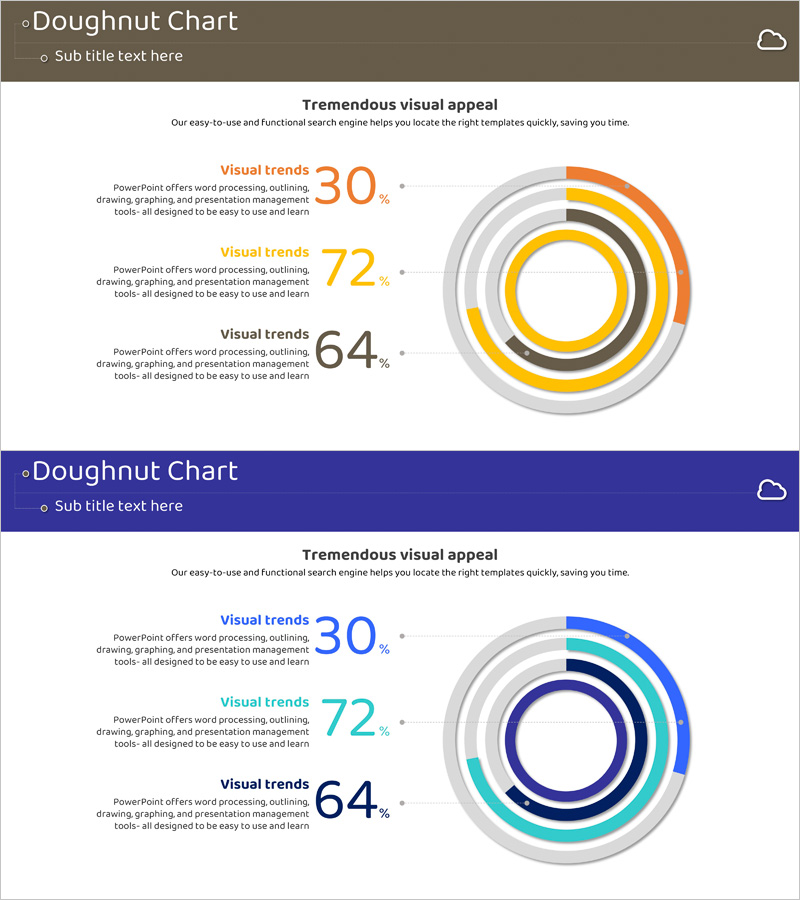
Service Sector Development Status Graph – Visualizing Competitive Edge with Doughnut Chart
#Product/Service #Market and Competitor Analysis #Graph
-
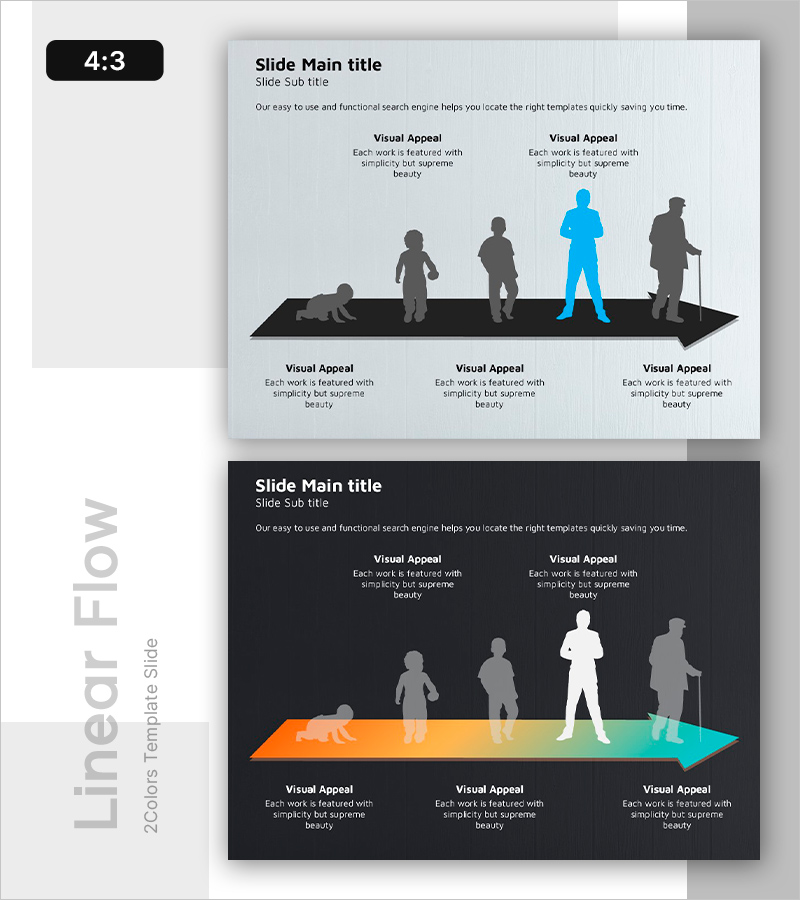
Characteristic Diagram by Growth Process – Customer Analysis and Service Introduction
#Product/Service #Market and Competitor Analysis #Diagram
-
Market Share Analysis Donut Chart – Competitive Edge in the Market
#Product/Service #Market and Competitor Analysis #Graph
