
Market and Competitor Analysis
Donut Chart for Visualizing Learning Progress
RJ0500029_22
- Last Update 12/21/2025
- File Size 1.2MB
- # of Slides 2
- File Format PPTX
- Slide Ratio 16:9
- Color
Keywords
About the Product
This slide features a donut chart designed to effectively visualize learning progress. With a contemporary design and vibrant colors, it emphasizes the topic and enhances audience engagement by harmoniously integrating numbers and images. Utilizing 'green' and 'brown' colors, it evokes a natural feel, perfect for educational presentations or performance analysis. The chart allows for easy text and graph replacements, rated as 'easy' in editing difficulty, enabling swift adaptation for various presentation materials.
Related Products
-
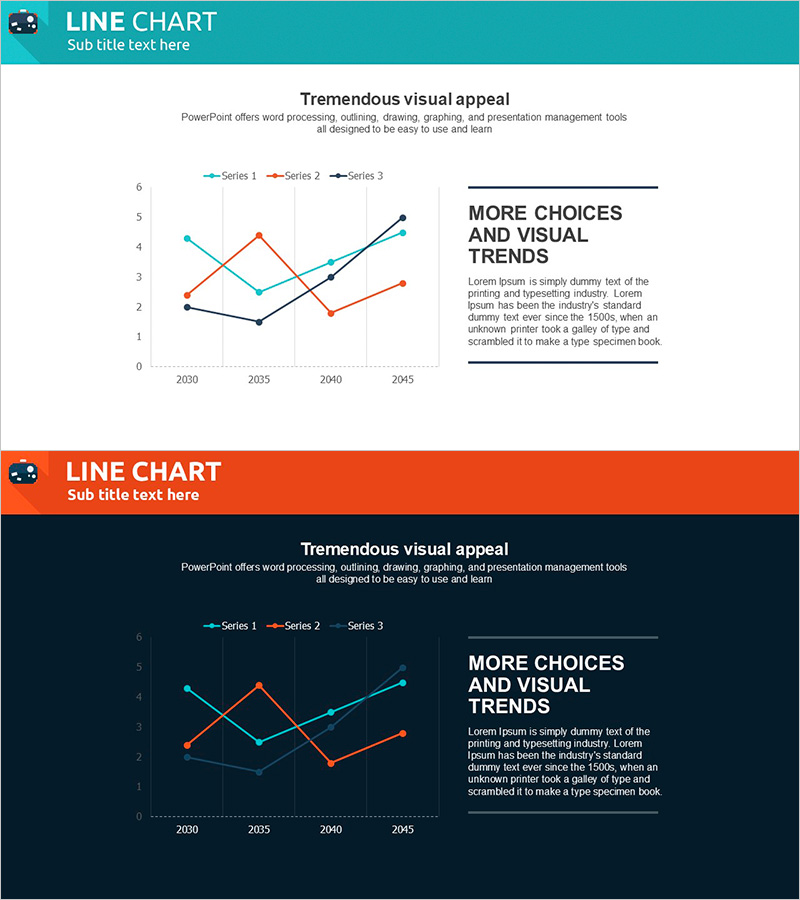
World Travel Break Line Chart Analysis – The Allure of Data Visualization
#Graph
-
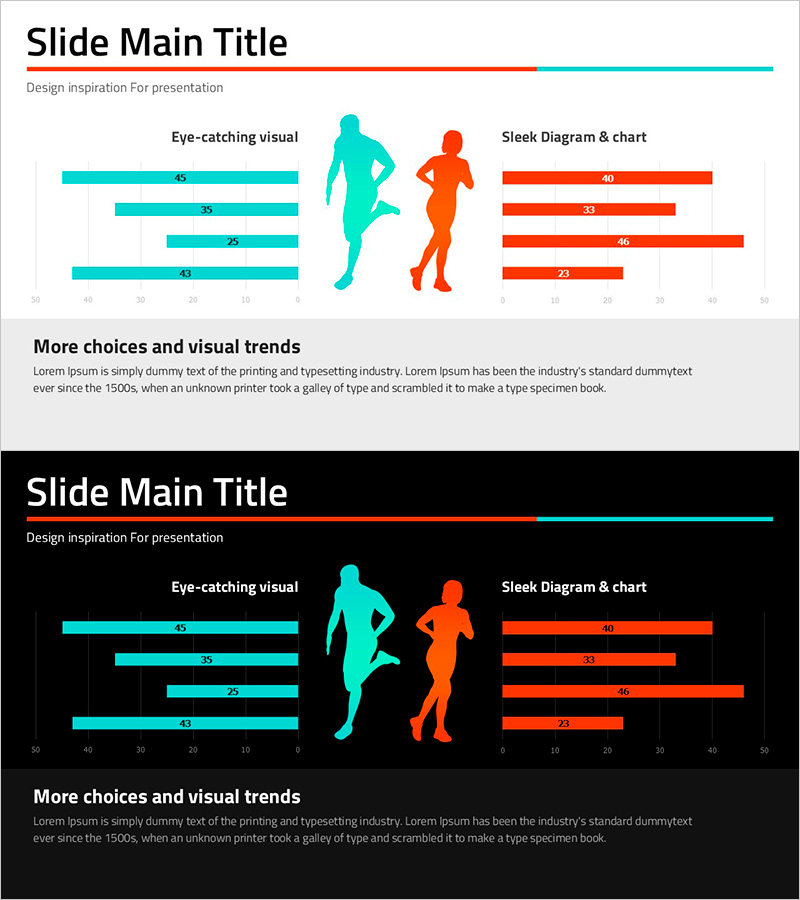
Statistics on People's Physical Fitness in Bar Chart – Insights Aimed at Competitive Advantage
#Market and Competitor Analysis #Graph #Other
-
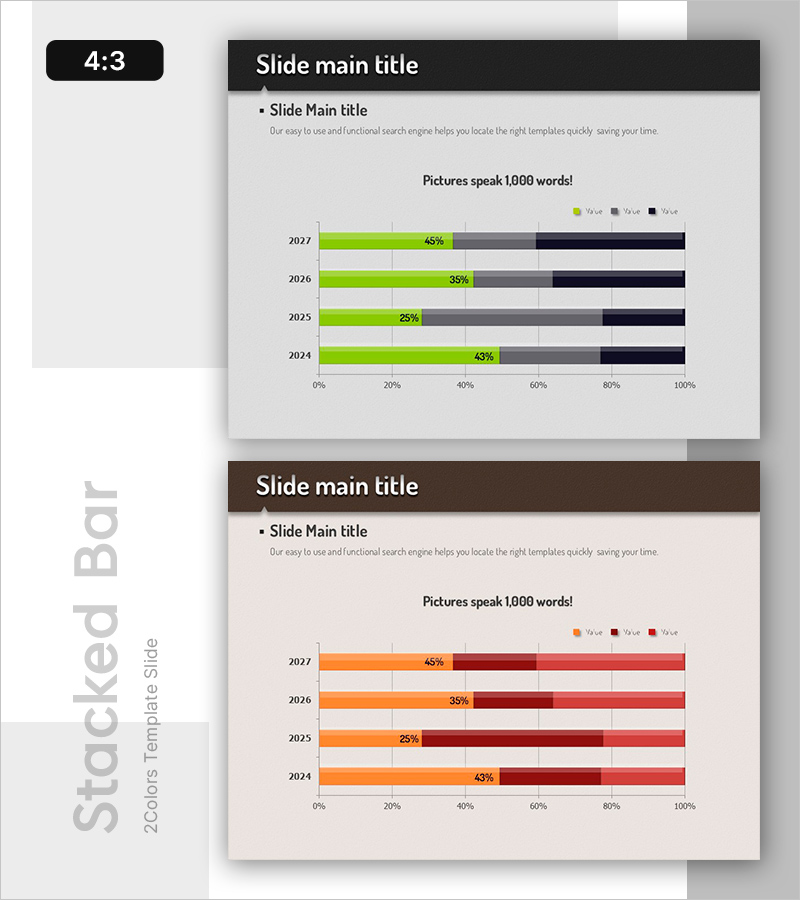
Stacked Bar Graph by Year with Detailed Breakdown - Market Analysis Insights
#Market and Competitor Analysis #Financial Plans and Performance #Graph
-
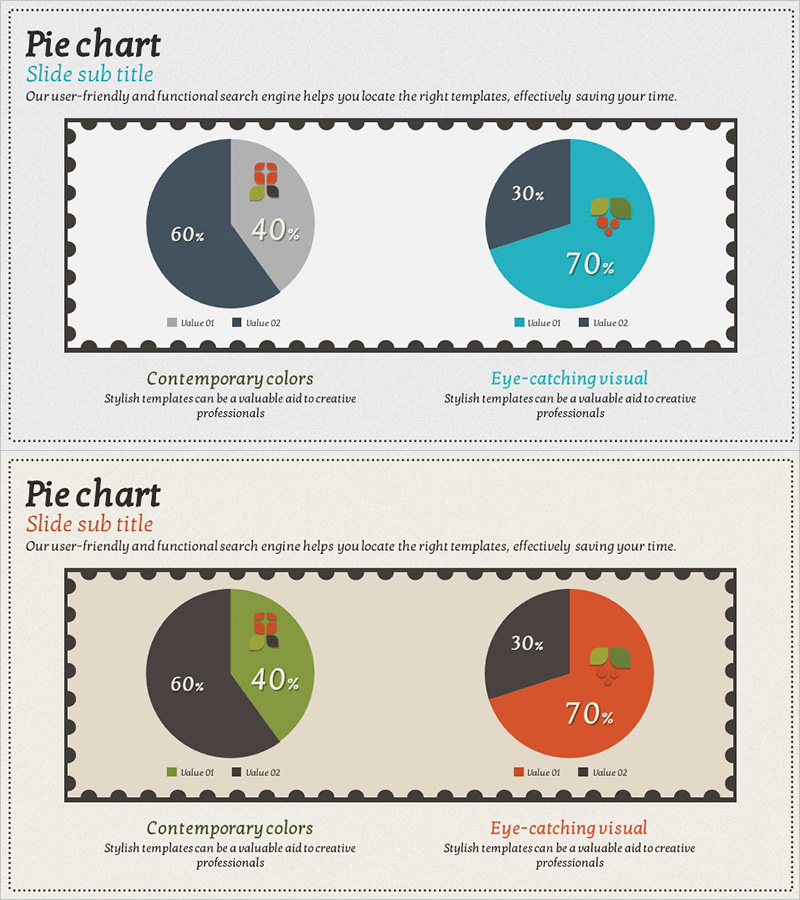
Market Share Circle Graph – Ideal for Market Analysis
#Market and Competitor Analysis #Graph #Market Share
