Graph
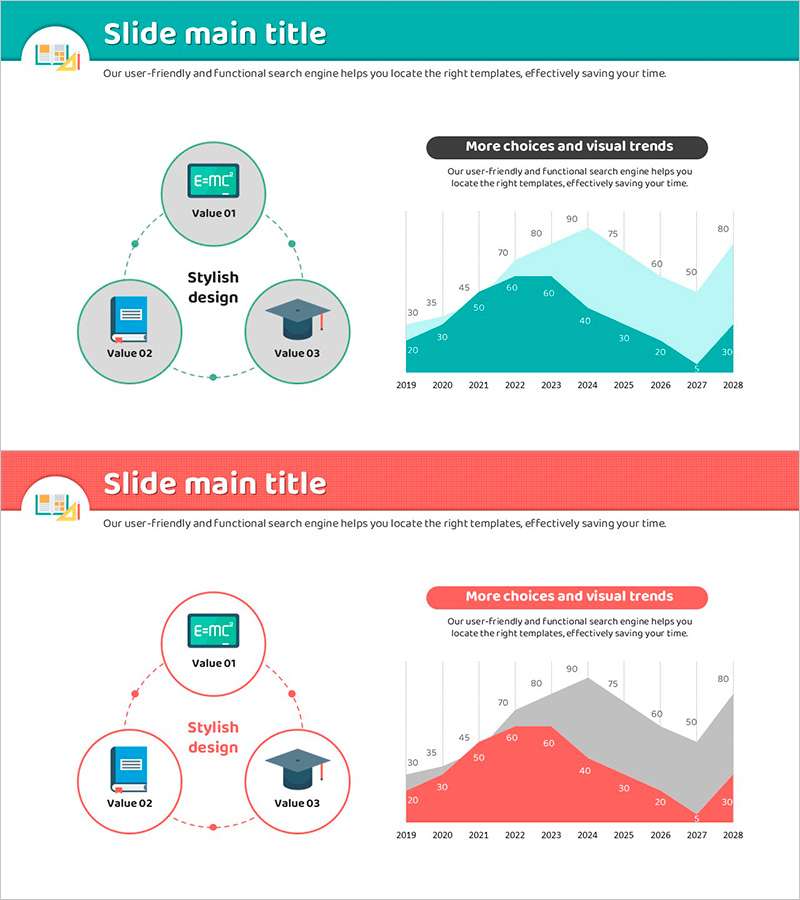
Research System and Area Chart – Visual Data Insights
RJ0500025_27
- Last Update 12/21/2025
- File Size 0.4MB
- # of Slides 2
- File Format PPTX
- Slide Ratio 16:9
- Color
About the Product
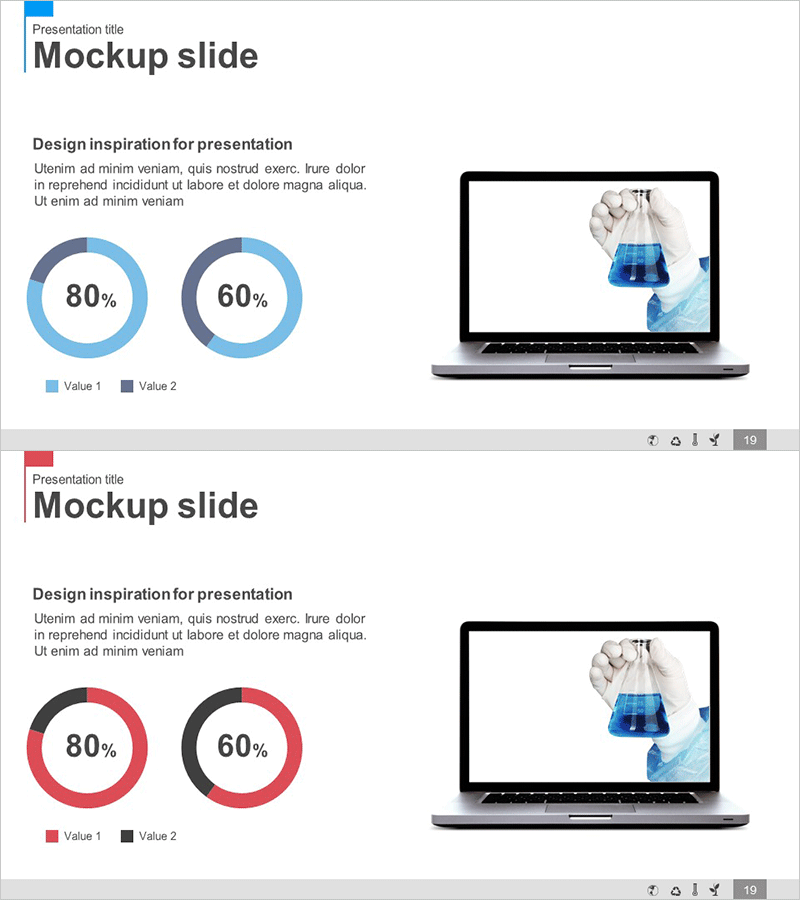
This slide is a PowerPoint template that uses an area chart for visual data representation. The contrasting turquoise and red colors stand out, while the clear layout and intuitive design effectively convey information. This slide is well-suited for research findings, analytical reports, or data-driven decision-making materials. It provides a user-friendly editing environment that allows for easy text and data replacement, with an overall editing difficulty rated as 'easy' for quick applicability.
Related Products
-
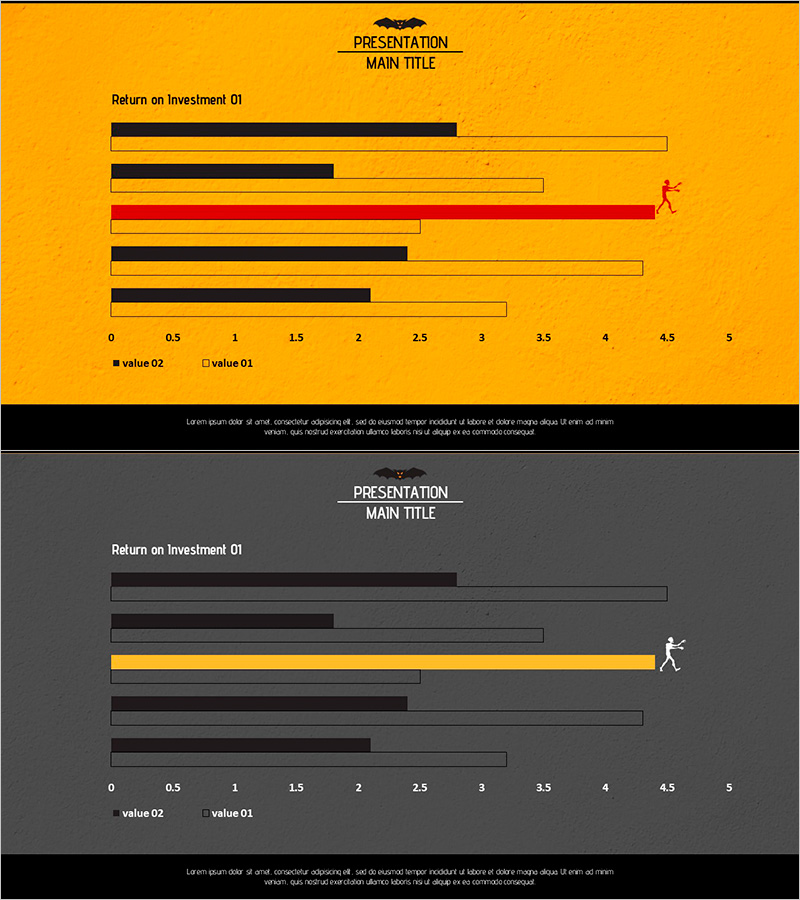
Yellow Red Highlight Bar Graph – Enhancing Data Visualization
#Graph
-
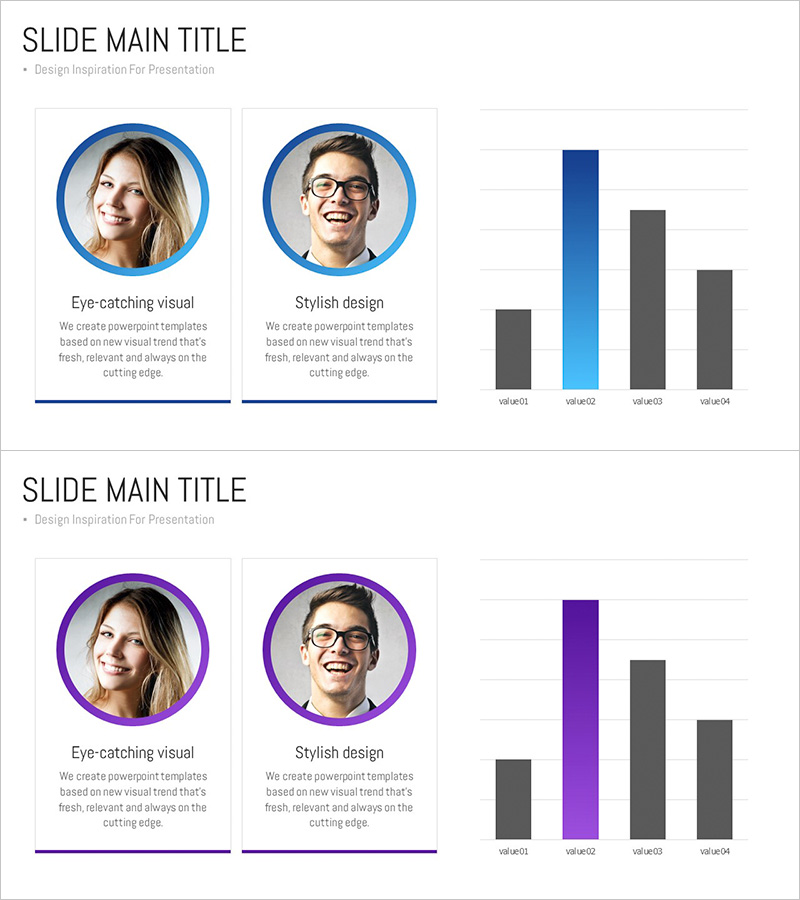
User Analysis Profile Graph – Insights into Customers
#Company Introduction #Business Management #Diagram
-
Quality Management of Health Fitness Expert Programs Slide Template
#Business Management #Operation Plan #Diagram
-
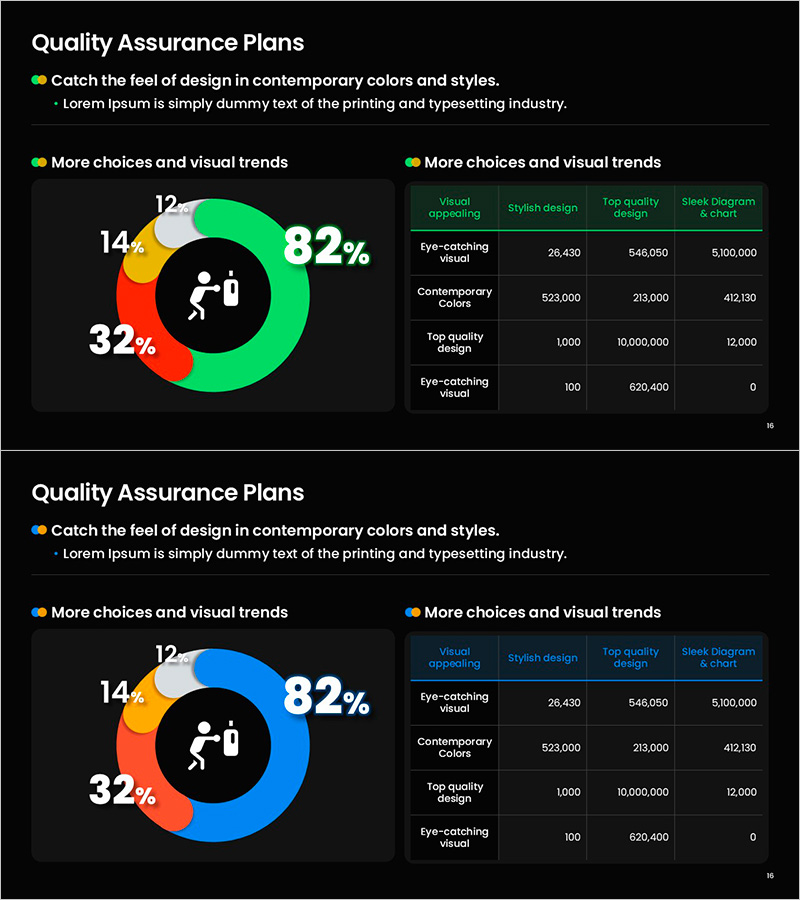
Blue Pink Market Share Donut Pie Chart
#Technology Sector #Market and Competitor Analysis #Graph
