User Analysis Profile Graph – Insights into Customers
RJ0300081_6
- Last Update 05/12/2025
- File Size 1.7MB
- # of Slides 2
- File Format PPTX
- Slide Ratio 16:9
- Color
Keywords
- #Content-Based Slides
- #Design-Based Slides
- #Company Introduction
- #Business Management
- #Diagram
- #Graph
- #Manpower
- #Project Staffing
- #Cluster
- #Column
- #Closed Cluster Diagram
- #Column Chart
- #16:9
- #vertical bar chart PowerPoint
- #customer analysis slide
- #user profile template
- #data comparison graph
- #how to create bar chart in PowerPoint
About the Product
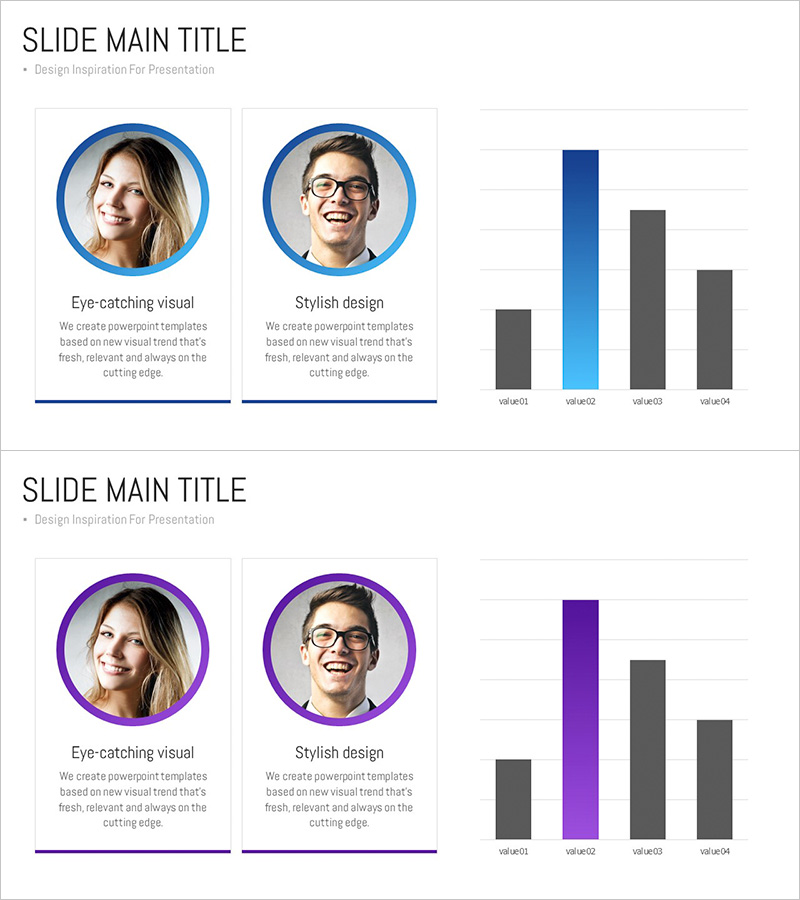
A vertical bar chart PowerPoint slide designed to visualize user analysis and customer insights. This 2-slide set combines profile cards with comparative data visualization, ideal for customer segmentation analysis, market research, and competitive analysis presentations. The blue and gray color scheme emphasizes key data points, optimized for 16:9 widescreen format in editable PPTX. Quickly customize profile information and chart values to match your presentation needs.
Usage Points
-
Main Usage
Visualize customer segmentation analysis, user profile comparisons, market research findings, and competitive data. The combination of 2 profile cards and 1 vertical bar chart enables simultaneous presentation of qualitative persona information and quantitative metrics.
-
How to Use
Enter customer persona details (name, job title, characteristics) in the profile cards. Input comparative metrics (satisfaction, purchasing power, interest level) as numerical values in the vertical bar chart. Use the blue accent bar to highlight the primary data point and draw audience attention.
-
Recommended For
Marketing managers, sales strategists, market research analysts, product managers, and business executives presenting customer insights, target market analysis, and competitive strategy. Suitable for board presentations, client pitches, and internal strategy meetings.
-
Slide Structure
Slide 1: Two circular profile frames (blue border) with portrait photos, job titles, and descriptive text. Slide 2: Vertical bar chart with 4 items (value01–value04) showing one blue bar and three gray bars for comparative analysis. 16:9 widescreen, fully editable PPTX format.
Related Products
-

Customer Type Analysis Bar Graph – Data Visualization for Customer Success
#Company Introduction #Market and Competitor Analysis #Customer Success Stories
-

Introducing Our Successful Developer Team Members
#Company Introduction #Market and Competitor Analysis #Diagram
-

Key Customer Analysis Data Charts – Assessing Market and Competition
#Company Introduction #Market and Competitor Analysis #Diagram
-

Introduction of Medical Personnel - Emphasizing Expertise with Diagrams
#Company Introduction #Diagram #Manpower
