Yellow Red Highlight Bar Graph – Enhancing Data Visualization
RJ0600039_24
- Last Update 07/01/2025
- File Size 2.7MB
- # of Slides 2
- File Format PPTX
- Slide Ratio 16:9
- Color
Keywords
About the Product
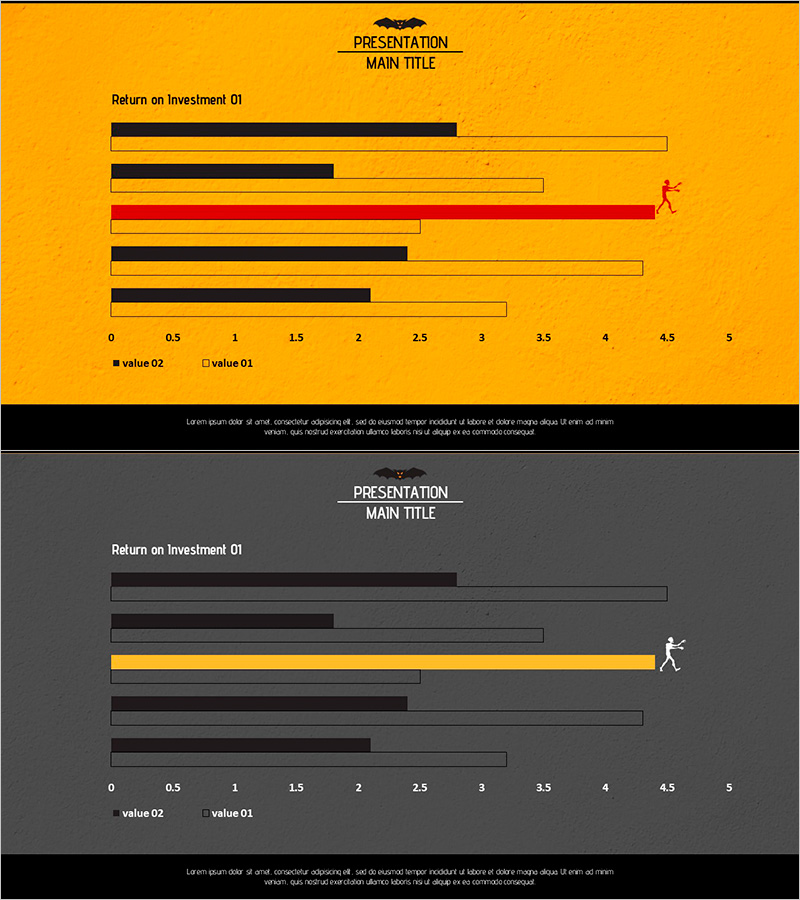
A horizontal bar chart PowerPoint slide optimized for ROI data comparison and analysis. Set against a yellow background with black, yellow, and red bar series, it clearly visualizes numerical differences across five items. Each item displays two data series (value 01 and value 02) simultaneously, making comparative analysis highly effective. The scale ranges from 0 to 5, normalizing data representation, while the red accent bar highlights key metrics. The 2-slide set includes both yellow and dark gray backgrounds for versatile presentation contexts, formatted in 16:9 widescreen for modern business environments. Instantly applicable to business proposals, ROI reports, performance analysis documents, and executive presentations.
Usage Points
-
Main Usage
Compares two data series across five items—such as ROI, performance metrics, departmental results, or quarterly targets—simultaneously. The red accent bar draws audience attention to critical indicators, enabling data-driven decision-making.
-
How to Use
Deploy in the analysis section of proposals and reports to showcase performance comparisons, goal achievement rates, competitive benchmarking, or market share distribution. The yellow background conveys optimism; the dark gray background suits serious analytical tone.
-
Recommended For
Financial analysts, marketing managers, executives preparing performance reports, management consultants, and sales professionals benefit from this template. Ideal for quarterly performance reviews, investment ROI analysis, marketing channel effectiveness comparison, and stakeholder presentations.
-
Slide Structure
Five items arranged vertically, each displaying two horizontal bars side-by-side representing value 01 and value 02. All bars share a 0–5 numerical axis. A legend distinguishes the two data series. One red accent bar emphasizes a key metric visually.
Related Products
-

Visualizing Market Overview with Area Charts and Analytical Texts – Strengthening Competitive Edge
#Market and Competitor Analysis #Graph #Other
-

Technology Services Market Share and Status Graph – Yellow and Red
#Market and Competitor Analysis #Graph #Market Status
-

Motion Radar Chart for Effective Data Visualization
#Product/Service Introduction #Graph #Features
-

Idea Development Analysis Chart – Data-Driven Innovation
#Product/Service Introduction #Business Introduction #Diagram
