Market and Competitor Analysis
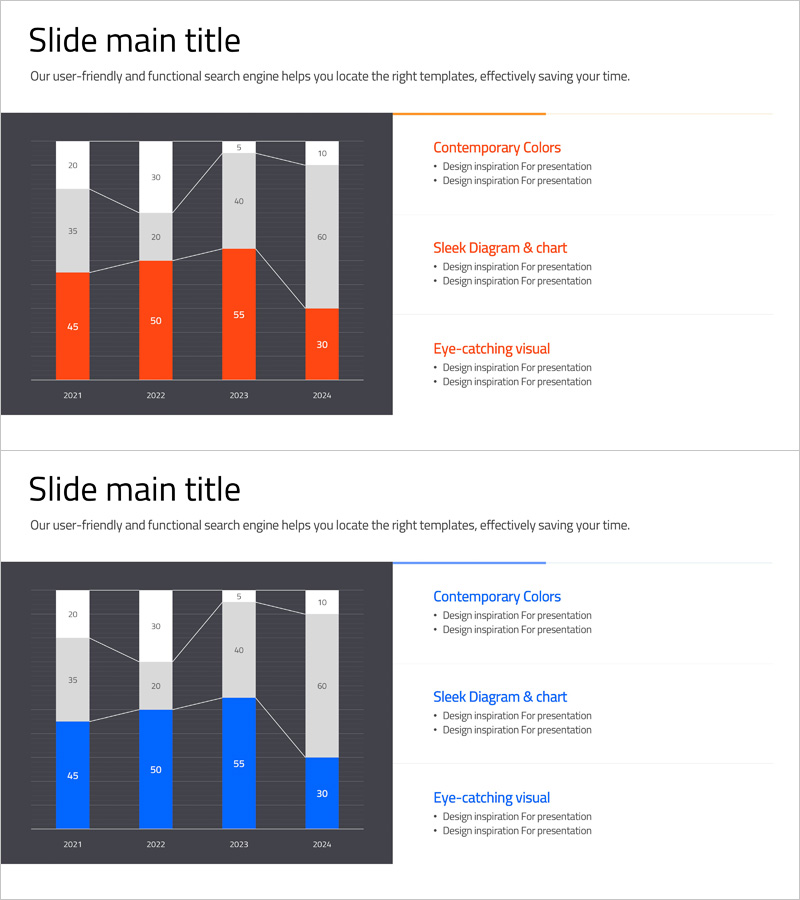
Analysis Vertical Bar Graph – Market Competitiveness Visualization
RJ0400061_20
- Last Update 12/21/2025
- File Size 0.3MB
- # of Slides 2
- File Format PPTX
- Slide Ratio 16:9
- Color
Keywords
About the Product
This slide presents an analysis vertical bar graph that visually represents market and competitor data. It uses contemporary colors in orange and blue to enhance the effectiveness of information delivery, allowing clear comparisons of trends by year. The slide is designed for easy text and graph replacement, making the editing difficulty rated as 'easy'. This slide is applicable for investment proposals, management meetings, and marketing analysis reports.
Related Products
-
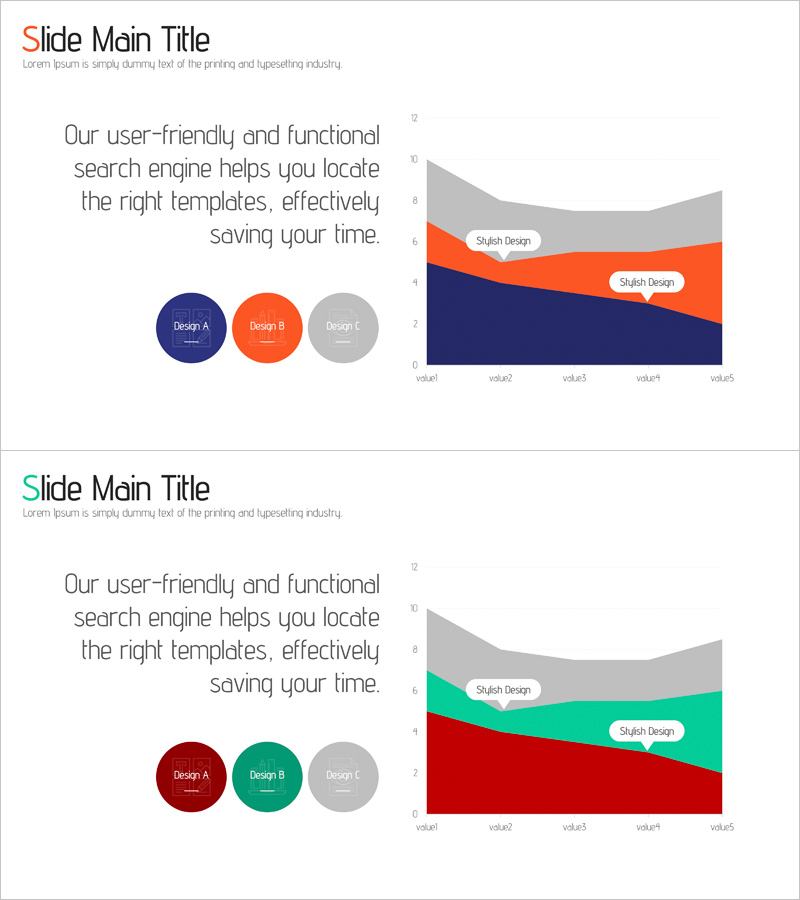
Competitive Comparison Area Diagram – Visualizing Market Advantage
#Market and Competitor Analysis #Graph #Other
-
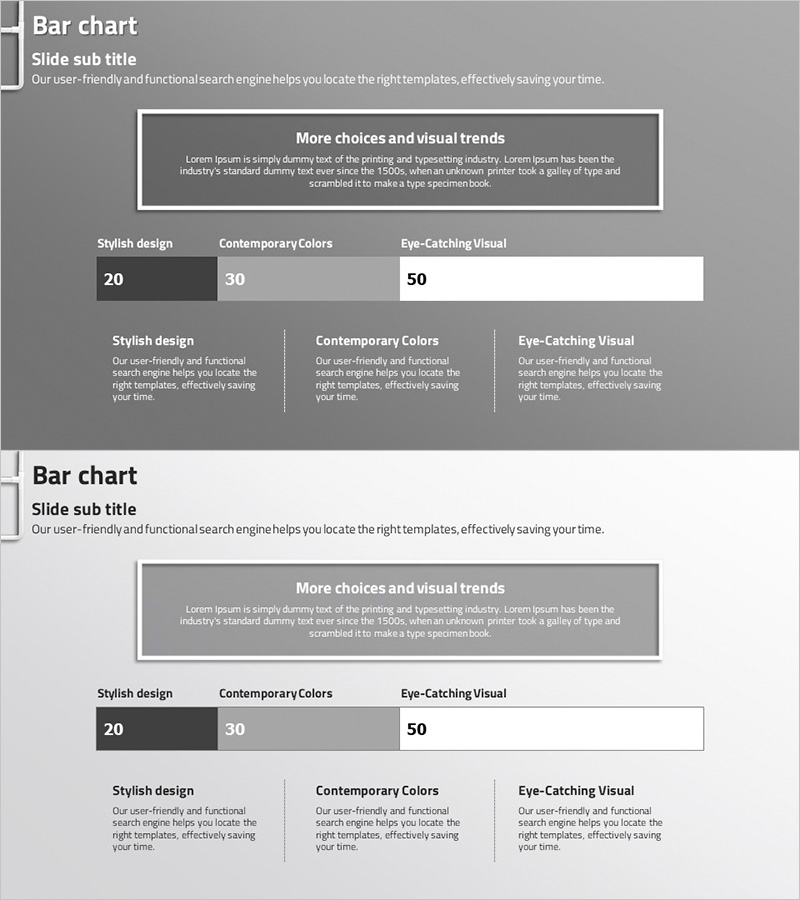
Colorless Bar Segmentation Graph – Market Analysis and Competitive Research
#Market and Competitor Analysis #Graph #Market Analysis
-
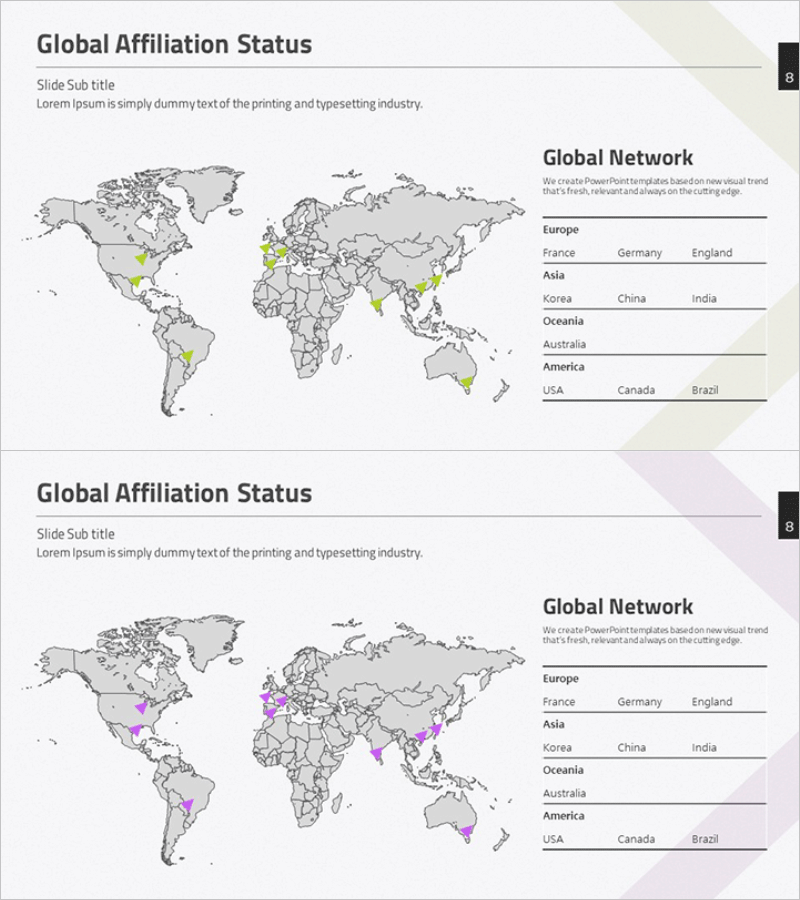
Global Network Affiliation Status – Market Trend Analysis
#Company Introduction #Market and Competitor Analysis #Diagram
-
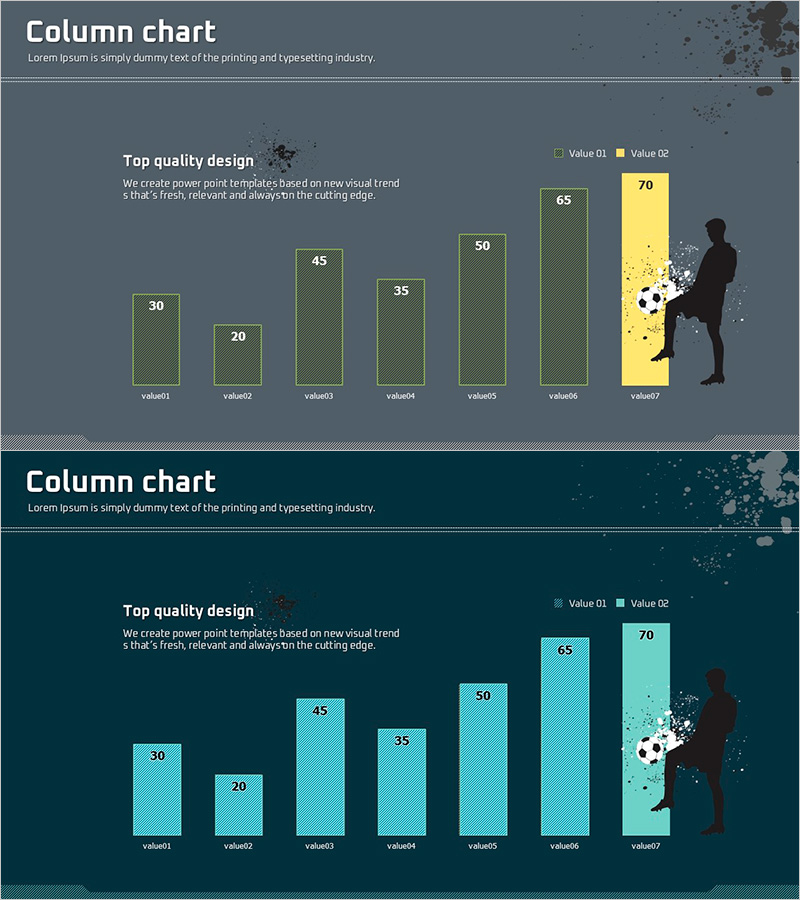
Soccer Illustration and Vertical Bar Graph – Market Analysis and Business Strategy Product
#Business Promotion Strategy #Market and Competitor Analysis #Graph
