Global Network Affiliation Status – Market Trend Analysis
RM0200001_7
- Last Update 02/01/2025
- File Size 3.9MB
- # of Slides 2
- File Format PPTX
- Slide Ratio 16:9
- Color
Keywords
- #Content-Based Slides
- #Design-Based Slides
- #Company Introduction
- #Market and Competitor Analysis
- #Diagram
- #Other
- #Global Network
- #Target Market
- #Table
- #Map
- #16:9
- #global network PowerPoint slide
- #world map affiliation status
- #international partnership PPT
- #company profile global map
- #market analysis network slide
About the Product
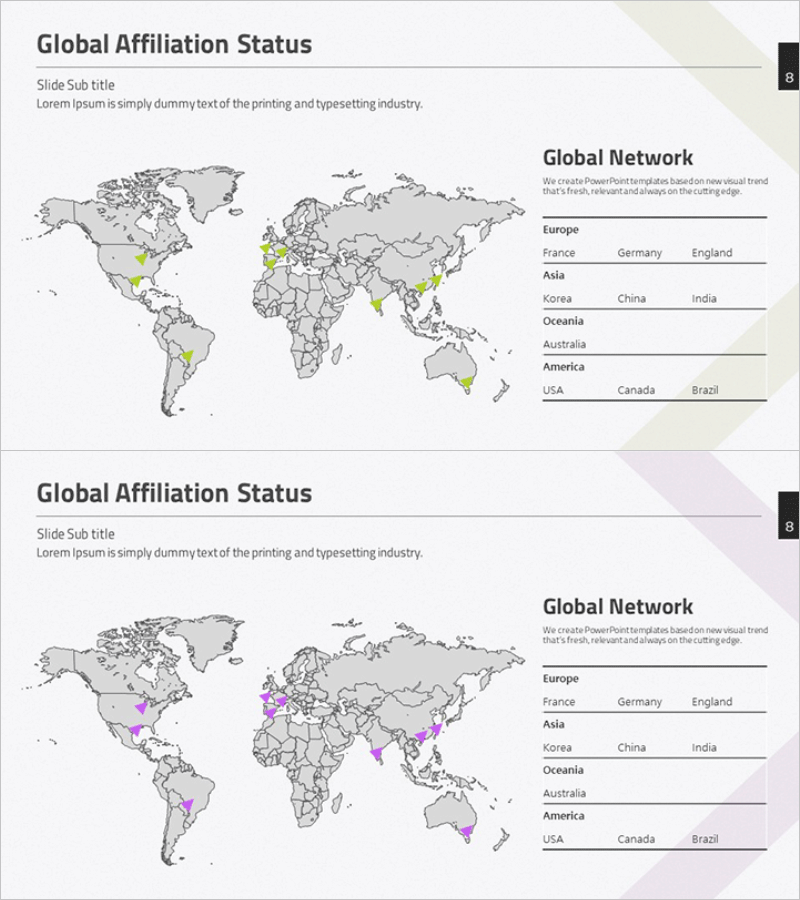
A 2-slide PowerPoint set visualizing global network and affiliation status using world maps with color-coded markers. The left side displays a world map with yellow and purple markers indicating key business locations, while the right side lists regional partners (Europe, Asia, Oceania, America) in organized columns. This layout effectively communicates global presence and partnership networks to investors and stakeholders in company presentations and market analysis sections. Available in 16:9 widescreen format, fully editable PPTX file.
Usage Points
-
Main Usage
Visualize your company's global business locations and partnership networks using geographic markers, enabling investors and partners to quickly understand your international reach and strategic alliances. Ideal for investor presentations, company profiles, and business proposals.
-
How to Use
Customize the map markers and their positions to match your actual business locations, then replace the regional partner lists with your real affiliates. Use slide 1 with yellow markers and slide 2 with purple markers to distinguish different partnership types (subsidiaries, partners, collaborators, etc.).
-
Recommended For
IR professionals, business development teams, and marketing managers at multinational corporations. Particularly useful for export-import companies, international consulting firms, and organizations presenting global expansion strategies to investors.
-
Slide Structure
Both slides feature identical layout: left side contains world map with location markers, right side displays regional headers (Europe, Asia, Oceania, America) with 3-4 partner names listed under each. Title and subtitle areas positioned at top. Different marker colors enable comparative analysis or timeline-based change visualization.
Related Products
-

Country-by-Country Revenue Analysis Table – Data-Driven Insights
#Company Introduction #Market and Competitor Analysis #Diagram
-

Global Market Analysis – Global Network and Target Market
#Company Introduction #Market and Competitor Analysis #Diagram
-

Presentation Template Visualizing Target Market Partnership Status
#Company Introduction #Market and Competitor Analysis #Diagram
-

Target Country Analysis Table by Continent – Market and Competitor Analysis
#Company Introduction #Market and Competitor Analysis #Diagram
