Market and Competitor Analysis
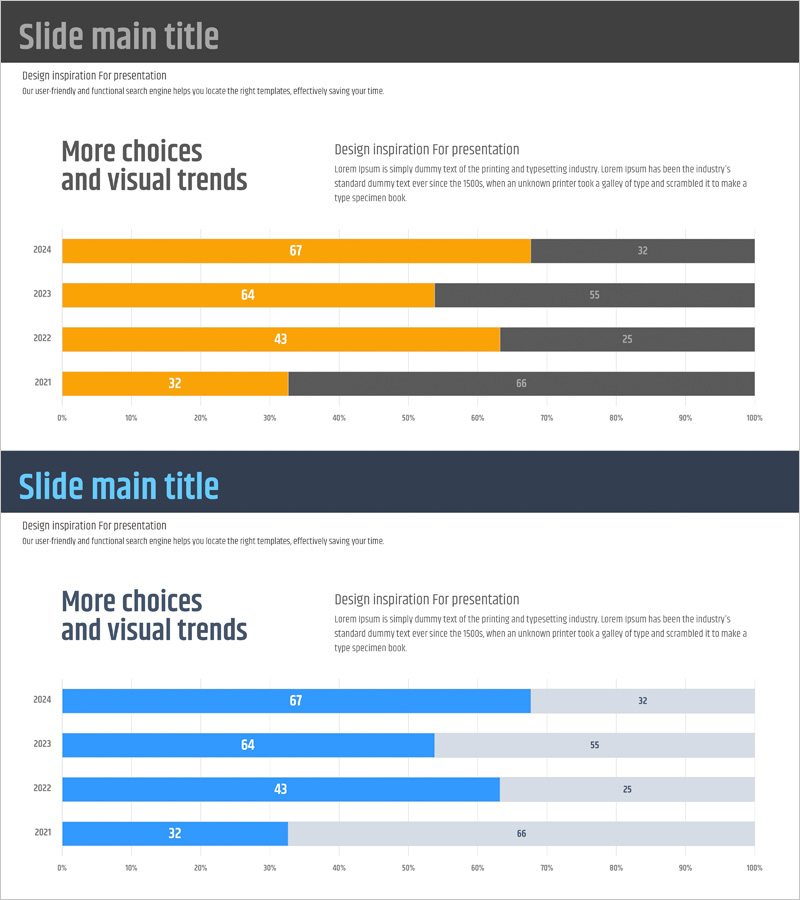
Bar Graph by Year – Market and Competitor Analysis
RJ0400058_14
- Last Update 12/21/2025
- File Size 0.2MB
- # of Slides 2
- File Format PPTX
- Slide Ratio 16:9
- Color
Keywords
About the Product
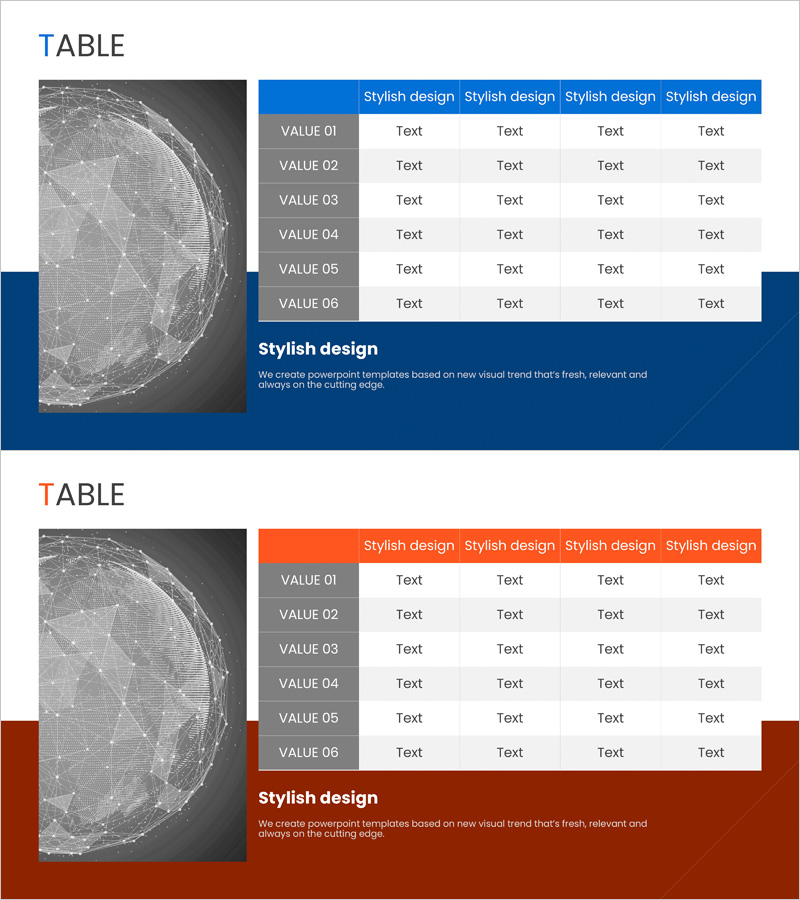
This slide features a bar graph by year, which clearly highlights data comparisons. With a simple yet intuitive design, it is suitable for market and competitor analysis, blending orange and blue backgrounds for a strong visual impact. Not only does it convey information, but it also aligns with visual flow, making it useful for presentations and reports. Text and data fields are easily replaceable, rated 'easy' in editing difficulty, allowing for quick integration into various presentations.
Related Products
-
Weather Status Analysis Graph
#Business Promotion Strategy #Market and Competitor Analysis #Diagram
-
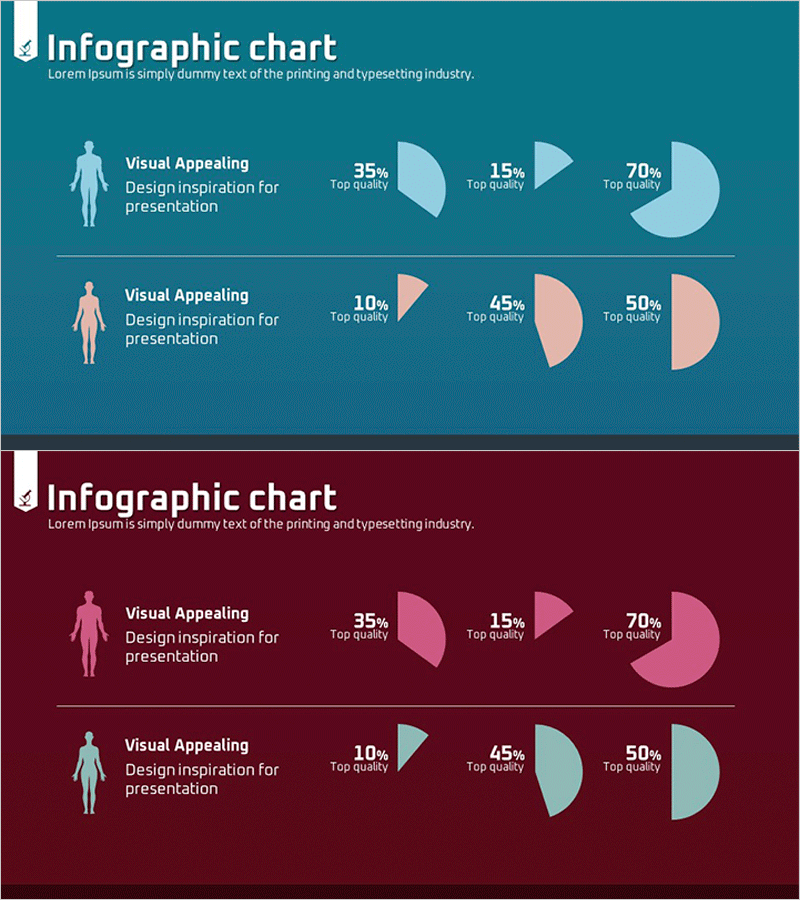
A Chart for the Total Population – Effective Market Analysis
#Market and Competitor Analysis #Diagram #Graph
-
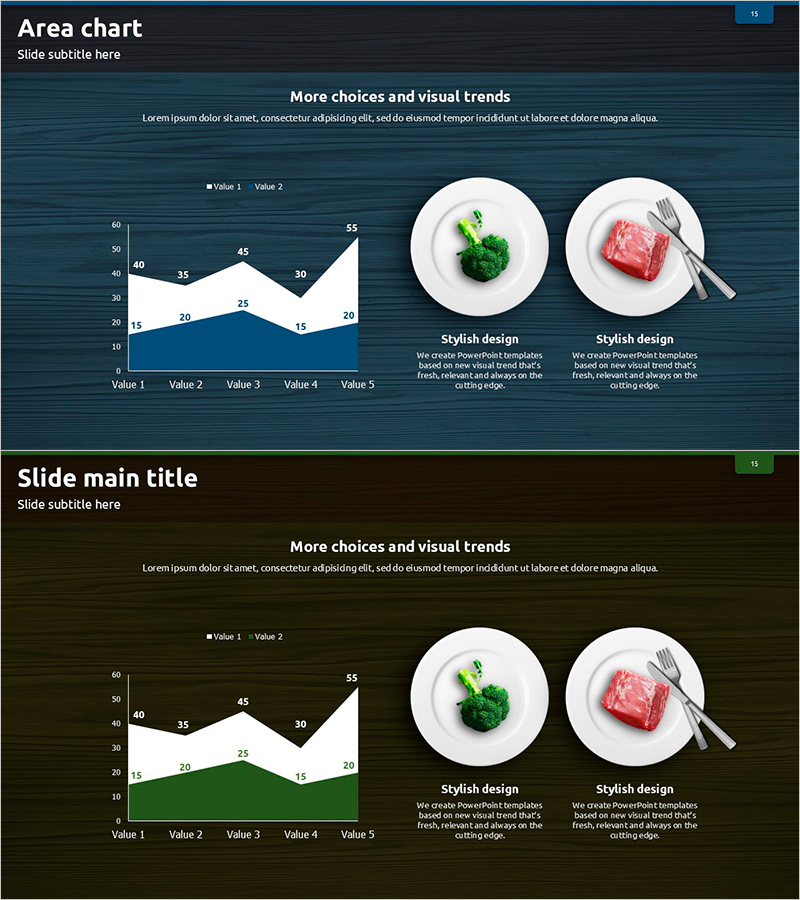
Healthy Food Ingredients and Area Charts
#Business Promotion Strategy #Market and Competitor Analysis #Graph
-
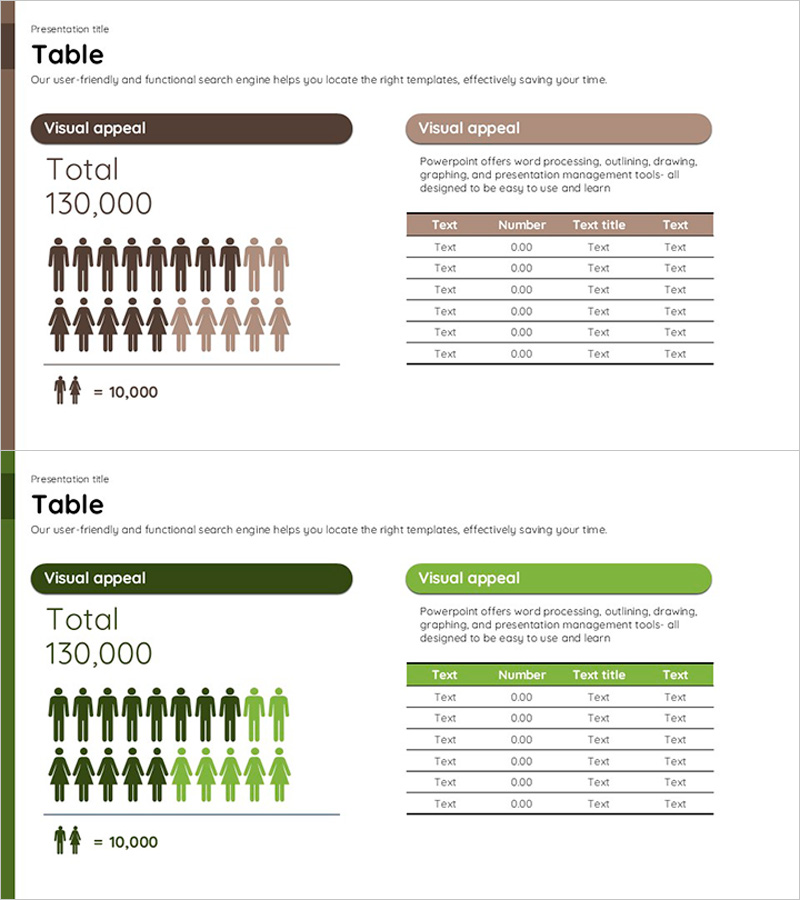
Global Network Market Analysis Table – Visualization of Data and Performance
#Business Promotion Strategy #Market and Competitor Analysis #Diagram
