Global Network Market Analysis Table – Visualization of Data and Performance
RJ0400070_22
- Last Update 06/06/2025
- File Size 0.7MB
- # of Slides 2
- File Format PPTX
- Slide Ratio 16:9
- Color
Keywords
- #Content-Based Slides
- #Design-Based Slides
- #Business Strategy
- #Market and Competitor Analysis
- #Diagram
- #Achievements
- #Market Analysis
- #Table
- #Standard Table
- #16:9
- #data table PowerPoint slide
- #market analysis table template
- #6-row 4-column table
- #global network presentation
- #information organization slide
- #business data visualization
About the Product
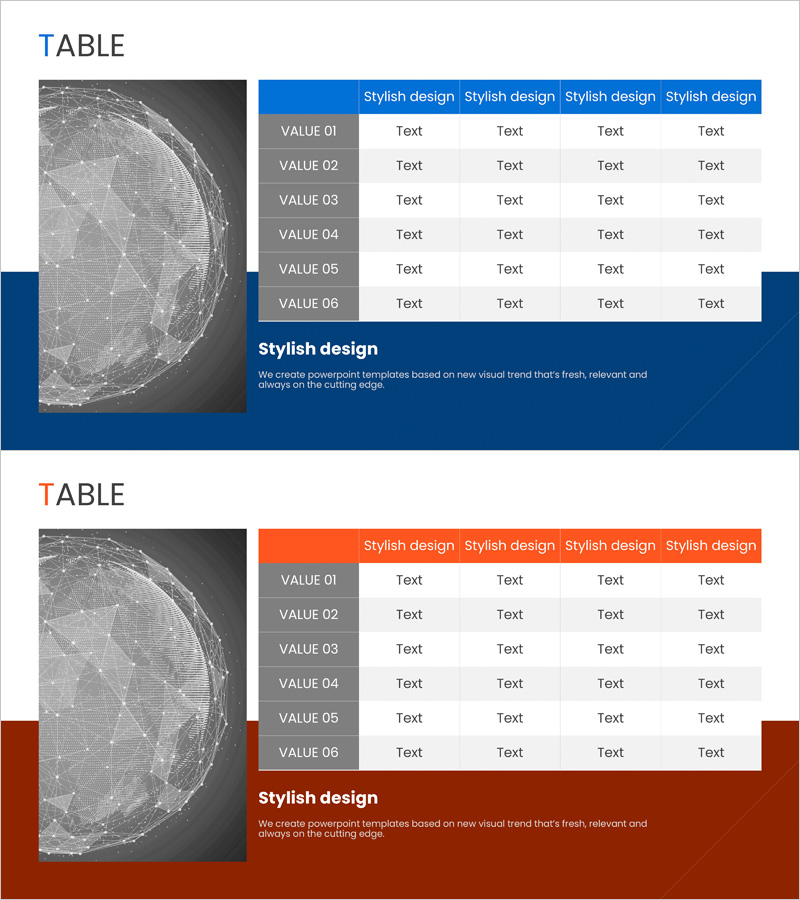
A comprehensive 6-row by 4-column data table PowerPoint slide set designed for global network market analysis presentations. The left side features a spherical network graphic representing global connectivity and data flow, while the right side displays a structured information table with clear visual hierarchy. Two color versions—blue and orange—are included, each with header row highlighting to emphasize data categories. The table includes row labels (VALUE 01 through VALUE 06) and four columns for flexible data entry, making it ideal for market data, performance metrics, competitive analysis, and comparative information visualization. Delivered as 2 slides in 16:9 widescreen format, ready for immediate use in professional presentations.
Usage Points
-
Main Usage
Presents market analysis, business performance, and comparative data in a structured, easy-to-understand table format. The left-side network graphic symbolizes global reach, connectivity, and data flow, while the right-side table organizes specific metrics and categories. Designed to help audiences quickly grasp complex information during presentations.
-
How to Use
Simply input your data into each VALUE row and the four column cells. Header colors (blue or orange) can be customized to match your presentation theme or corporate branding. Use in business reports, marketing plans, investor presentations, and quarterly reviews to display market conditions, competitor comparisons, and key performance indicators.
-
Recommended For
Ideal for executives, planning teams, marketing departments, and sales teams presenting market analysis, business performance, and customer data. Particularly suited for global business updates, network expansion strategies, and multi-metric comparisons. Recommended for business plans, quarterly reports, investor pitch decks, and strategic presentations requiring credible data representation.
-
Slide Structure
Two color versions (blue and orange) with one slide each, totaling 2 slides. Each slide features a 50% left-side spherical network graphic and 50% right-side 6-row by 4-column table. Header row uses accent color, row labels have gray background, and data cells have white background, creating clear information hierarchy and visual distinction.
Related Products
-

Match Illustration Bar Chart – Performance and Market Analysis
#Business Strategy #Market and Competitor Analysis #Diagram
-

Weather Analysis Table – Market Analysis and Business Strategy
#Business Vision and Strategy #Market and Competitor Analysis #Diagram
-

Business Income Statement Table – Visualizing Financial Performance
#Market and Competitor Analysis #Financial Plans and Performance #Diagram
-

Medical Market Analysis Table Slide
#Market and Competitor Analysis #Diagram #Market Analysis
