Free Graphs
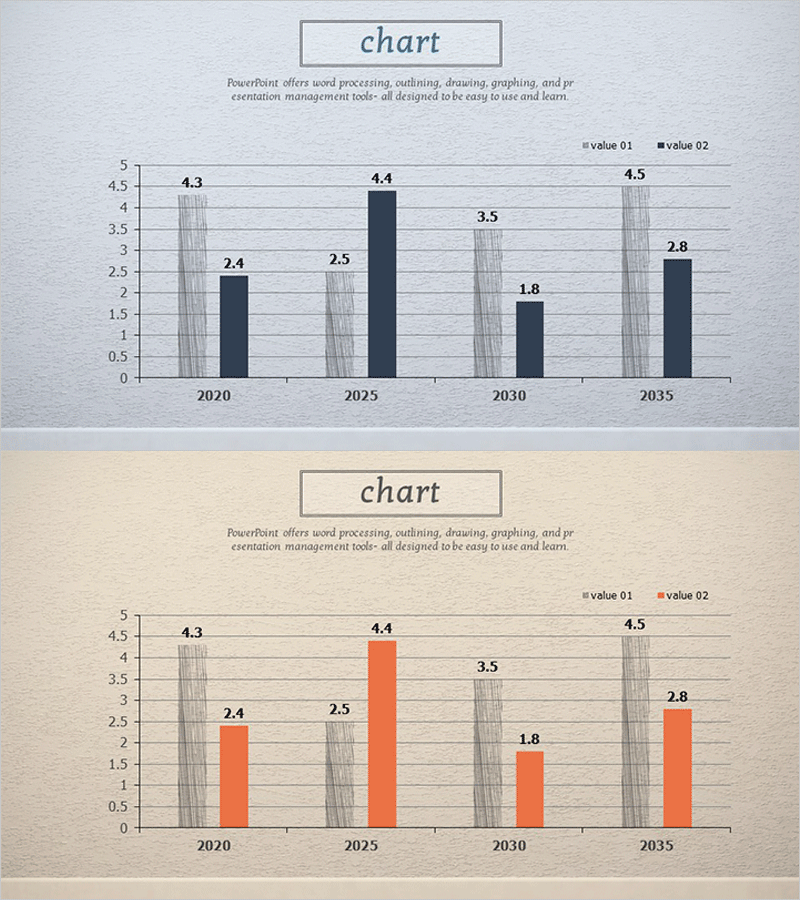
Market Analysis by Year Horizontal Bar Graph
RJ0400032_6
- Last Update 12/21/2025
- File Size 8.4MB
- # of Slides 2
- File Format PPTX
- Slide Ratio 16:9
- Color
Keywords
About the Product
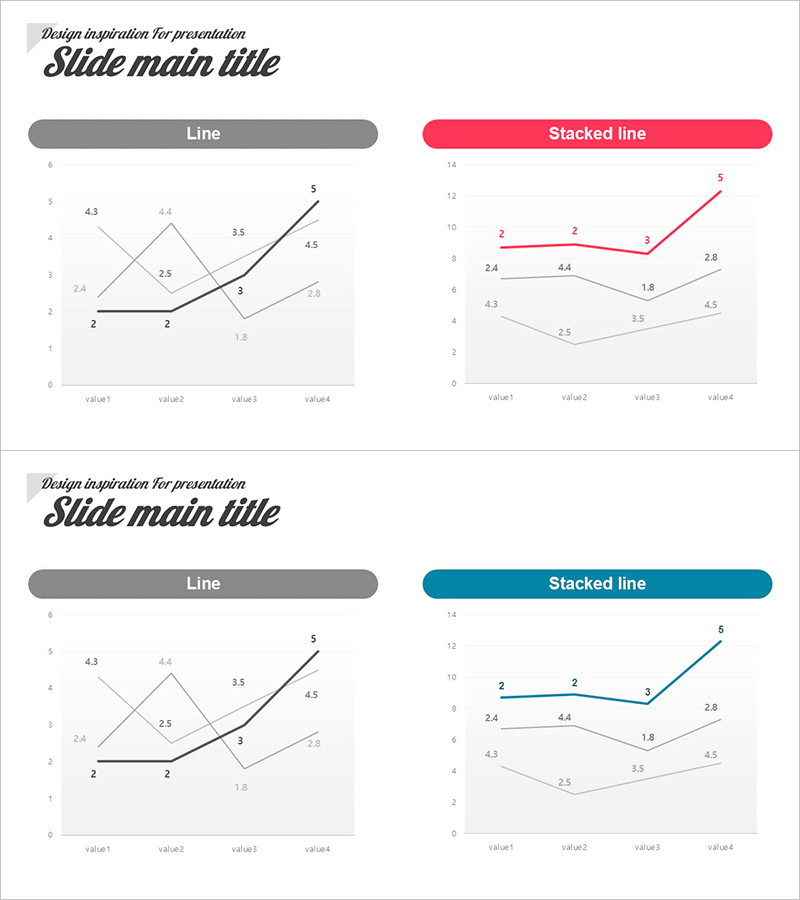
This slide visualizes market analysis data by year in a horizontal bar graph format. With a simple layout and intuitive design, it allows easy comparison and analysis of data. Especially emphasizes the growth and fluctuations of the market, supporting strategic business decisions. This slide is suitable for market and competitor analysis reports, investment proposals, etc. Text and data are easily replaceable, with an editing difficulty rated as 'easy' for quick application.
Related Products
-
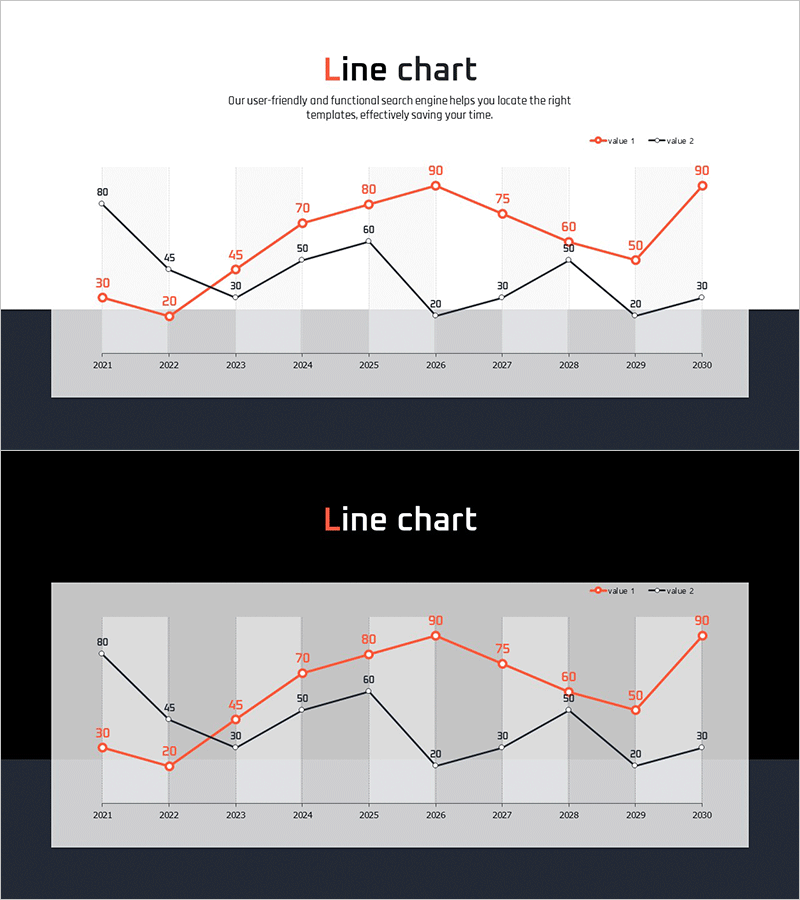
Year-by-Year Comparative Analysis Line Graph – Providing Market Insights
#Free Graphs
-
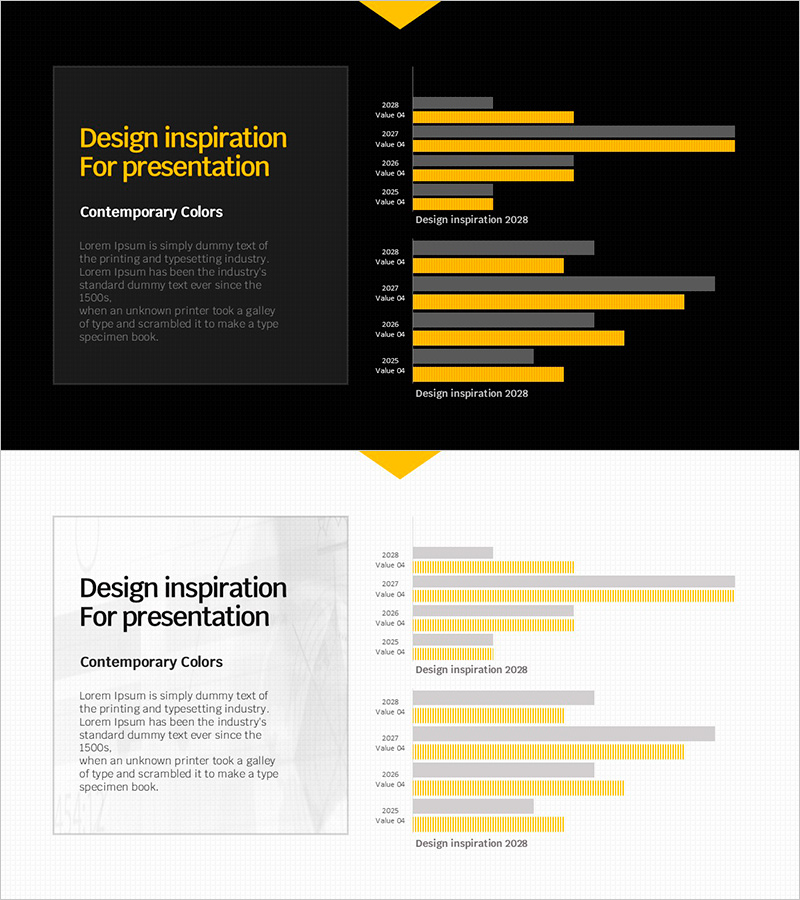
Visualizing 2028 Design Inspiration with Bar Graphs - Contemporary Colors
#Free Graphs
-
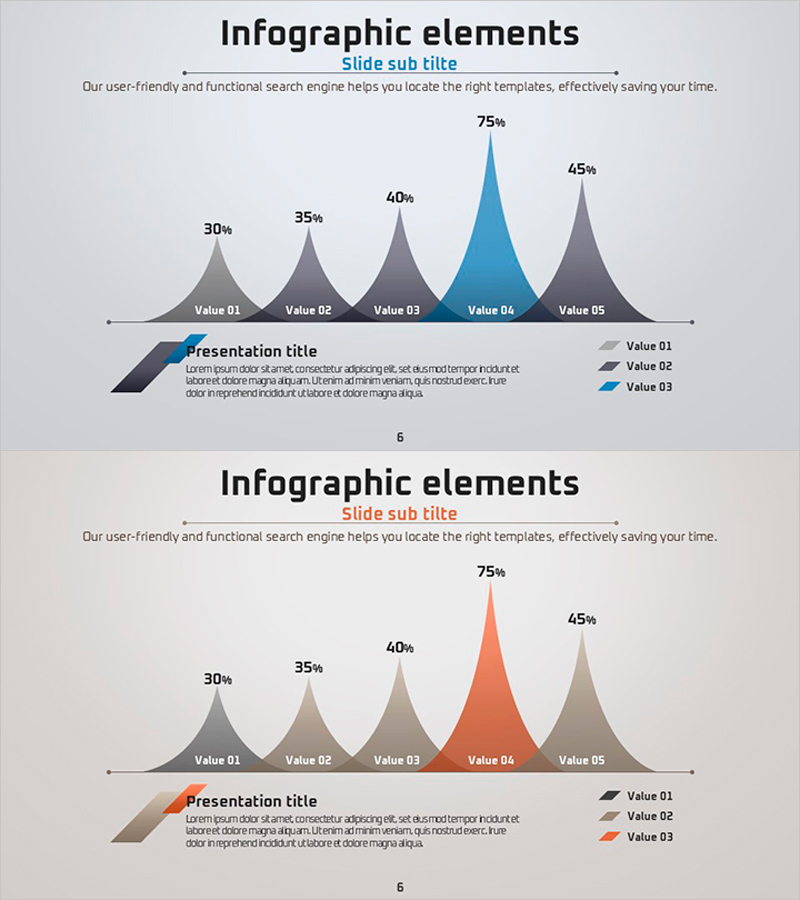
Pointed Graph Chart – The Pinnacle of Data Visualization
#Free Graphs
-
Data Visualization Presentation Slide Using Line Charts
#Free Graphs
