Financial Plans and Performance
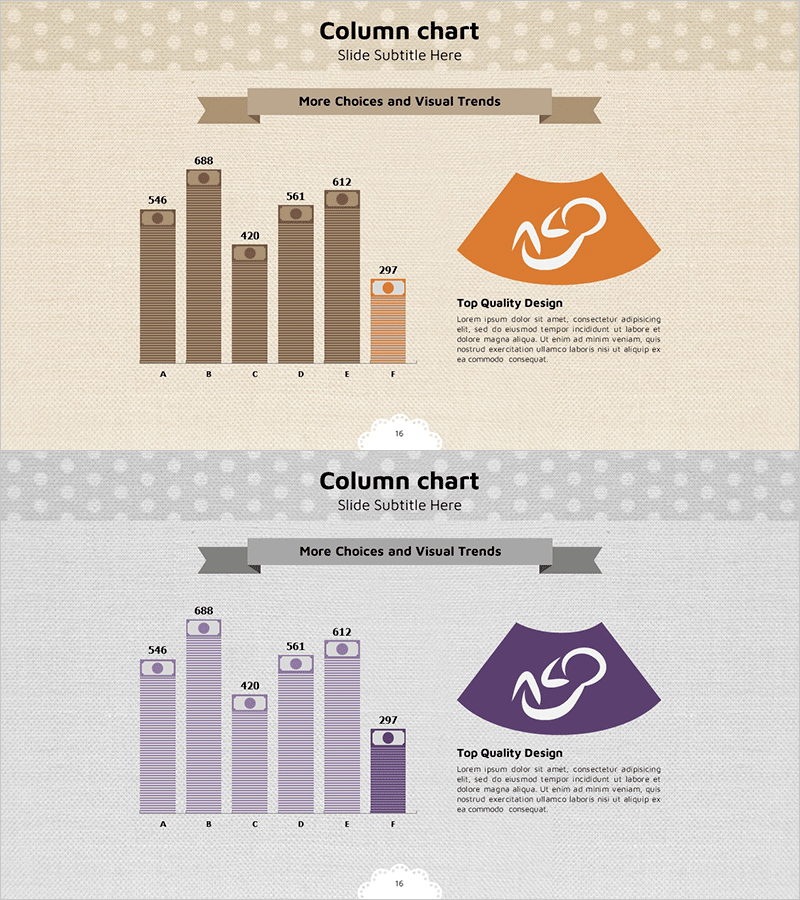
Childcare Expenses Analysis Graph
RJ0400030_15
- Last Update 12/21/2025
- File Size 8.7MB
- # of Slides 2
- File Format PPTX
- Slide Ratio 16:9
- Color
Keywords
About the Product
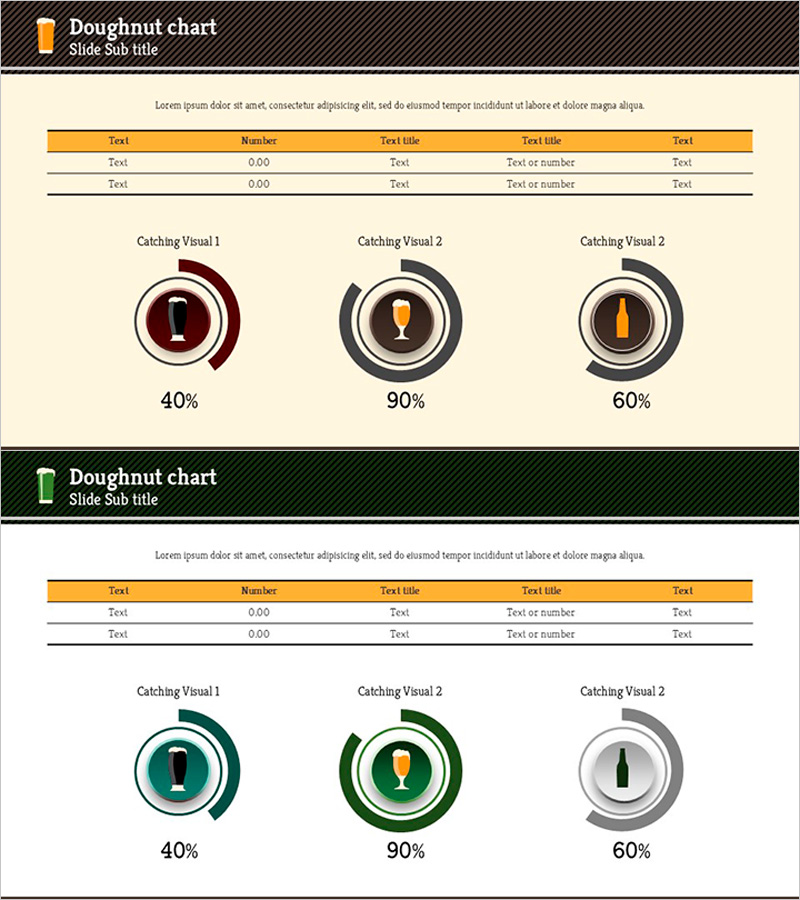
This slide provides a visual analysis of childcare expenses using both horizontal and vertical bar graphs. The warm brown and purple color combination conveys stability and elegance, with a clear structure for effective comparison. It can be utilized in various contexts such as financial planning and investment return analysis, supporting informed decision-making. The intuitive design allows for easy editing, with an overall editing difficulty rated as 'easy'.
Related Products
-
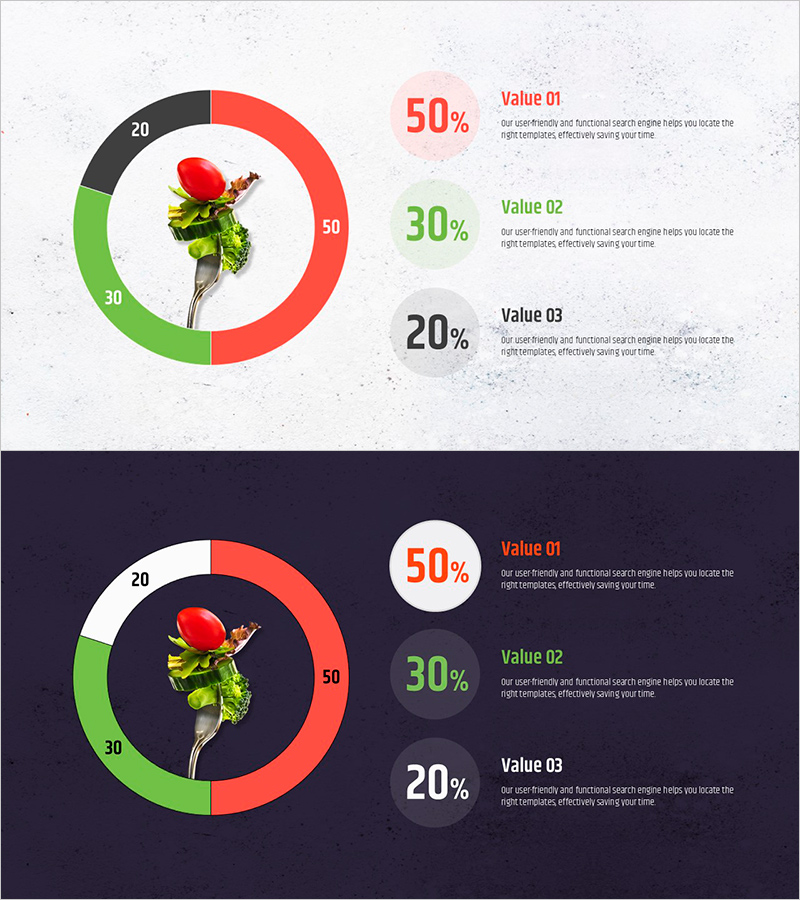
Donut Chart for Salad Proportion Visualization – Market Analysis
#Market and Competitor Analysis #Graph #Market Share
-
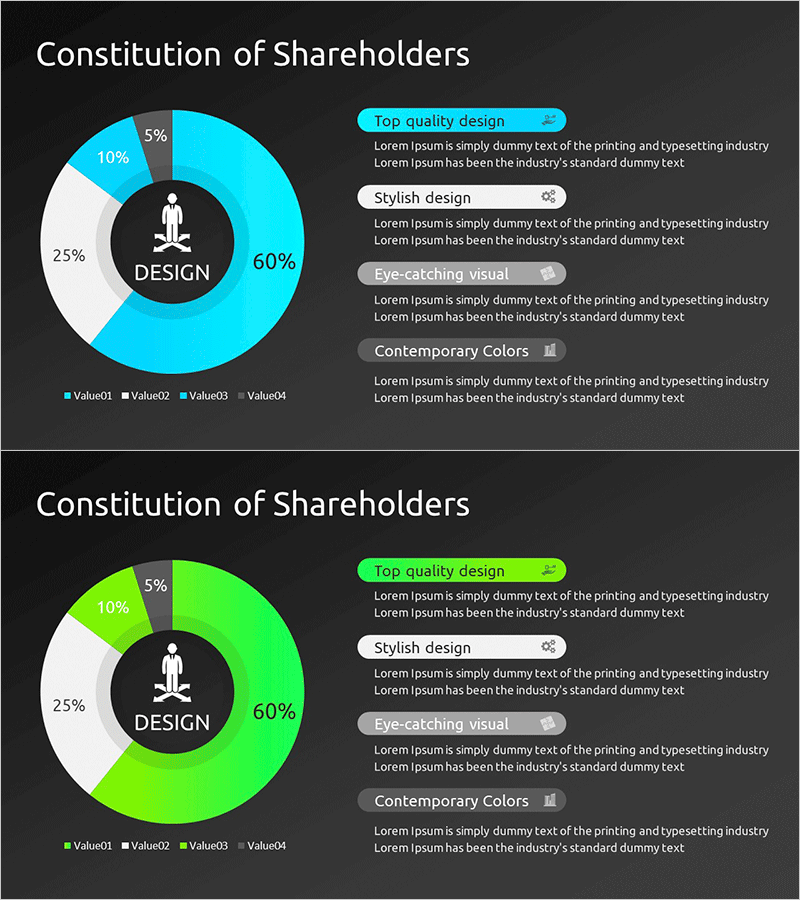
Key Shareholder Analysis One Donut Chart
#Company Introduction #Market and Competitor Analysis #Graph
-
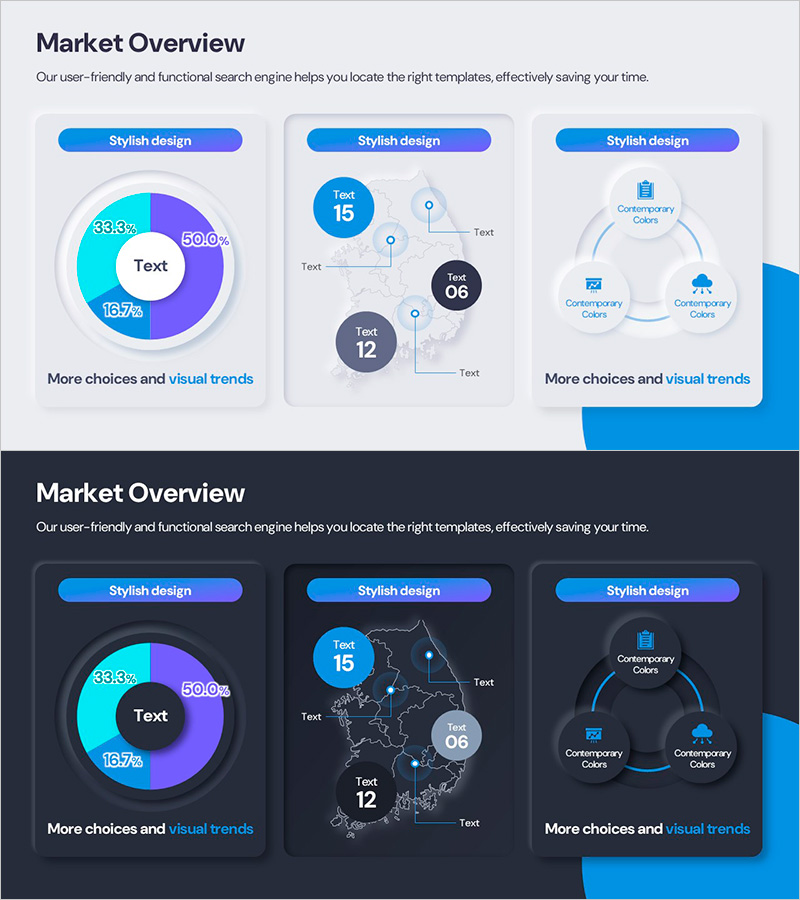
Visualizing Market Overview with Doughnut Chart Slide - Global Insights Provided
#Market and Competitor Analysis #Diagram #Graph
-
Liquor Sales Chart – Market Analysis and Performance Management
#Market and Competitor Analysis #Financial Plans and Performance #Diagram
