Donut Chart for Salad Proportion Visualization – Market Analysis
RJ0800048_6
- Last Update 08/29/2025
- File Size 5.8MB
- # of Slides 2
- File Format PPTX
- Slide Ratio 16:9
- Color
Keywords
About the Product
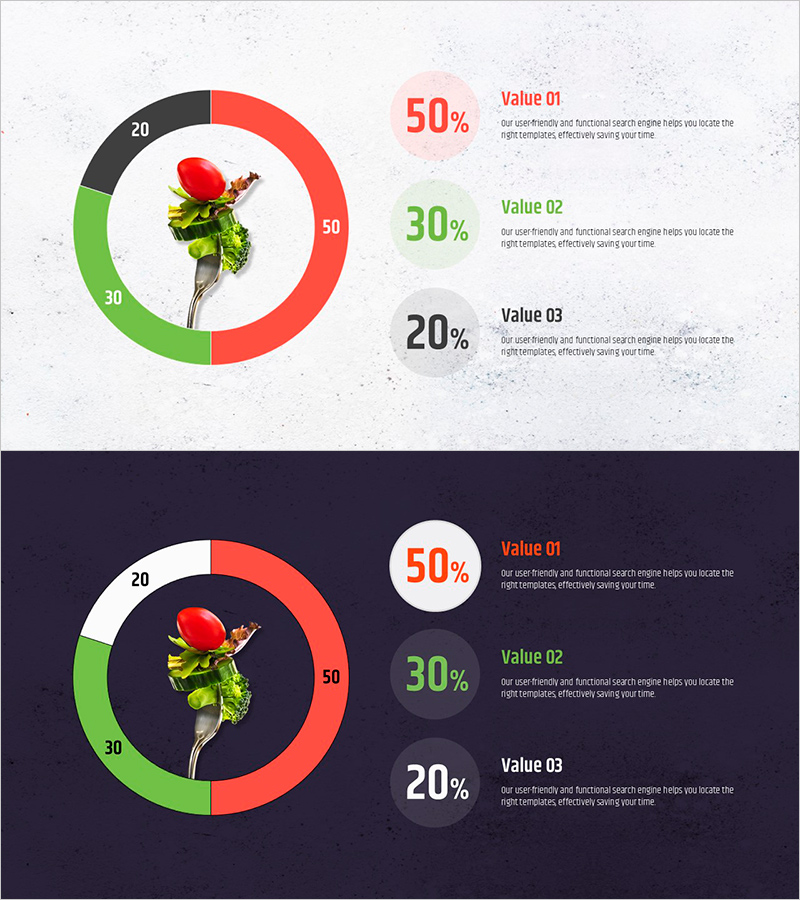
A donut chart PowerPoint slide optimized for market analysis and competitive comparison. The open-center design allows you to insert an image in the middle, displaying the proportion of three items such as product mix, market share, or category breakdown at a glance. The three-color palette—red, green, and gray—clearly distinguishes each segment, with two background versions: light and dark. Numerical labels are prominently displayed for data accuracy, making it ready to use in presentations, reports, and marketing plans. This 2-slide set includes both light and dark themed layouts.
Usage Points
-
Main Usage
Intuitively express the proportional relationship of three items such as market analysis, competitive positioning, or product composition. The open center area allows you to place product images or key icons, emphasizing both data and visual elements simultaneously.
-
How to Use
Slide 1 features a light background with Value 01, 02, 03 descriptions positioned on the right. Slide 2 provides the same structure with a dark background. Edit the percentages and labels on each slide to input your actual data, then double-click the center image area to replace it with your product photo or icon.
-
Recommended For
Ideal for marketing plans, market analysis reports, product presentations, executive briefings, and sales pitches. Particularly suited for food, retail, consumer goods, and IT industries when comparing market share, customer demographics, or product line composition.
-
Slide Structure
Donut chart with center image insertion area / 3 segments (red 50%, green 30%, gray 20%) / 3 text boxes on right (Value 01, 02, 03 labels with descriptions) / Light background version + dark background version = 2 slides total
Related Products
-

Avocado Share Chart – Market Status and Competitive Analysis
#Market and Competitor Analysis #Graph #Other
-

Beer Carbonated Doughnut Chart – Market Share Analysis
#Market and Competitor Analysis #Financial Plans and Performance #Graph
-

Red Sky Donut Chart – Market Share Analysis
#Company Introduction #Market and Competitor Analysis #Graph
-

Watercolor Customer Analysis Donut Chart – Visualizing Market Share
#Market and Competitor Analysis #Graph #Market Share
