
Business Promotion Strategy
IT Service Future Outlook and Expected Effects Graph – Analyzing Impact
RJ0400028_16
- Last Update 12/21/2025
- File Size 1.1MB
- # of Slides 2
- File Format PPTX
- Slide Ratio 16:9
- Color
Keywords
About the Product
This slide visualizes the future outlook and expected effects of the IT services using a line graph. With a modern and sophisticated graph design, it allows for intuitive data comparisons, making it ideal for various business presentations. The harmonious combination of red and blue colors conveys trust and dynamism while clearly presenting theme-related information. It works exceptionally well for presentations on business strategy and market analysis. Text, graphs, and icons are easily replaceable, rendering the editing difficulty as 'easy'. Utilize this slide in various presentation scenarios!
Related Products
-
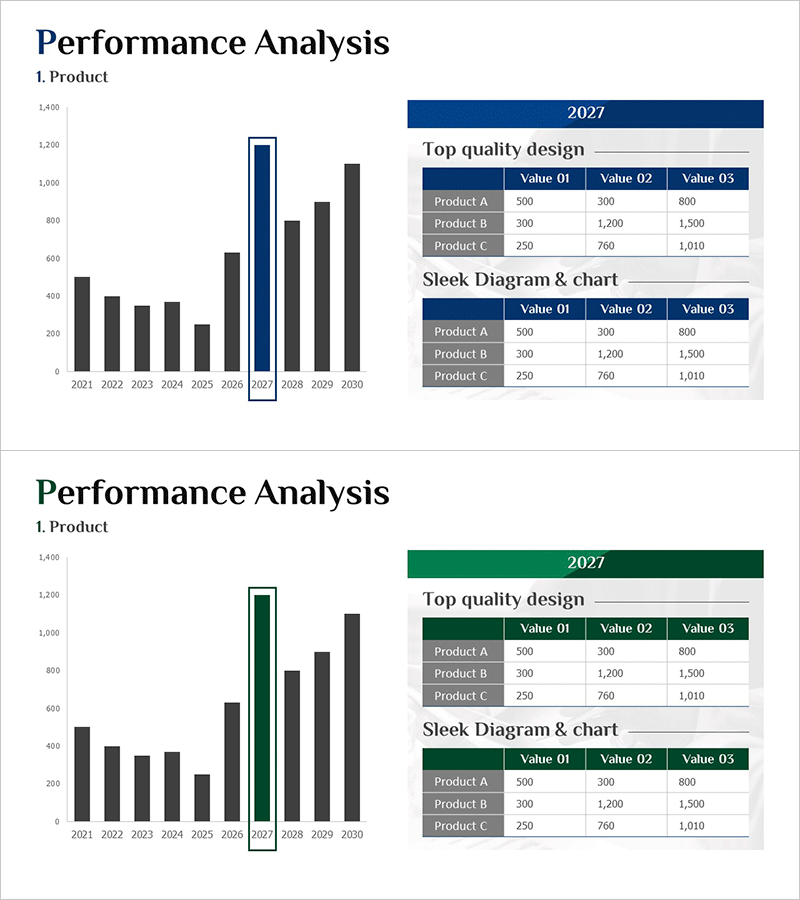
Product Top Sales Analysis Graph – Market and Competitor Analysis
#Business Promotion Strategy #Market and Competitor Analysis #Diagram
-
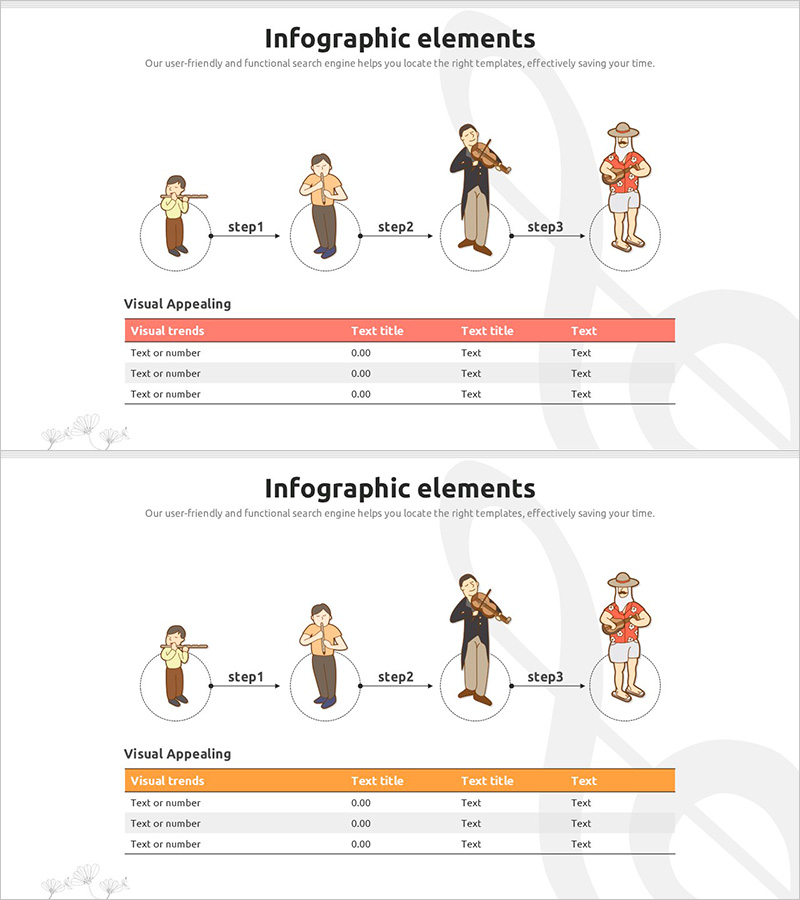
Step by Step Diagram of Playing a Musical Instrument - Fundamentals of Music
#Business Promotion Strategy #Business Management #Diagram
-
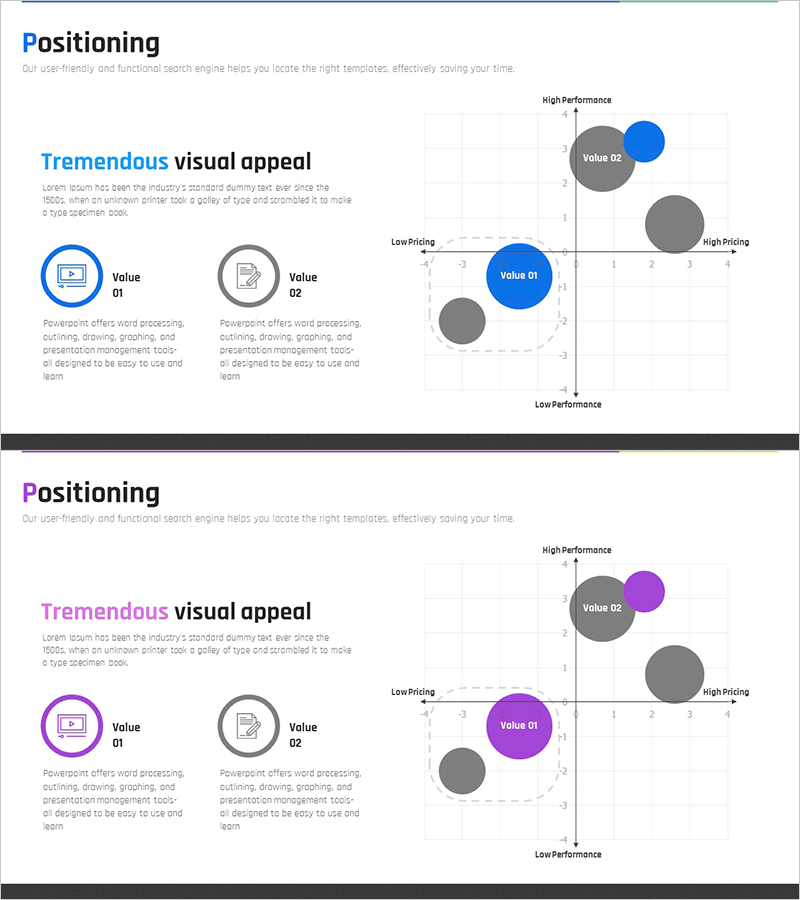
Market Competitiveness Comparison Positioning Map – Marketing Strategy and Analysis
#Marketing Plan and Strategy #Diagram #Graph
-
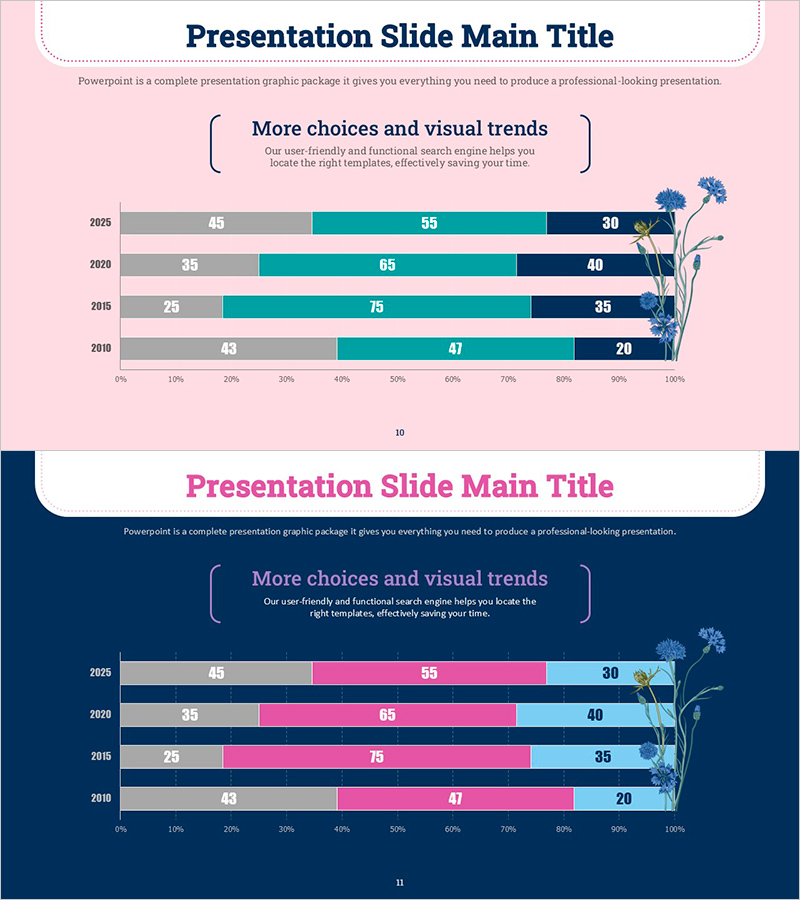
Bar Graph for Market Trends Analysis – Visualizing Change
#Market and Competitor Analysis #Graph #Industry Trends
