Bar Graph for Market Trends Analysis – Visualizing Change
RJ0600104_10
- Last Update 08/28/2025
- File Size 0.5MB
- # of Slides 2
- File Format PPTX
- Slide Ratio 16:9
- Color
Keywords
- #Content-Based Slides
- #Design-Based Slides
- #Market and Competitor Analysis
- #Graph
- #Industry Trends
- #Horizontal Bar
- #Segmented Horizontal Bar
- #16:9
- #horizontal bar chart PowerPoint
- #market trend analysis slide
- #year-over-year comparison presentation
- #data visualization template
- #business report graph slide
About the Product
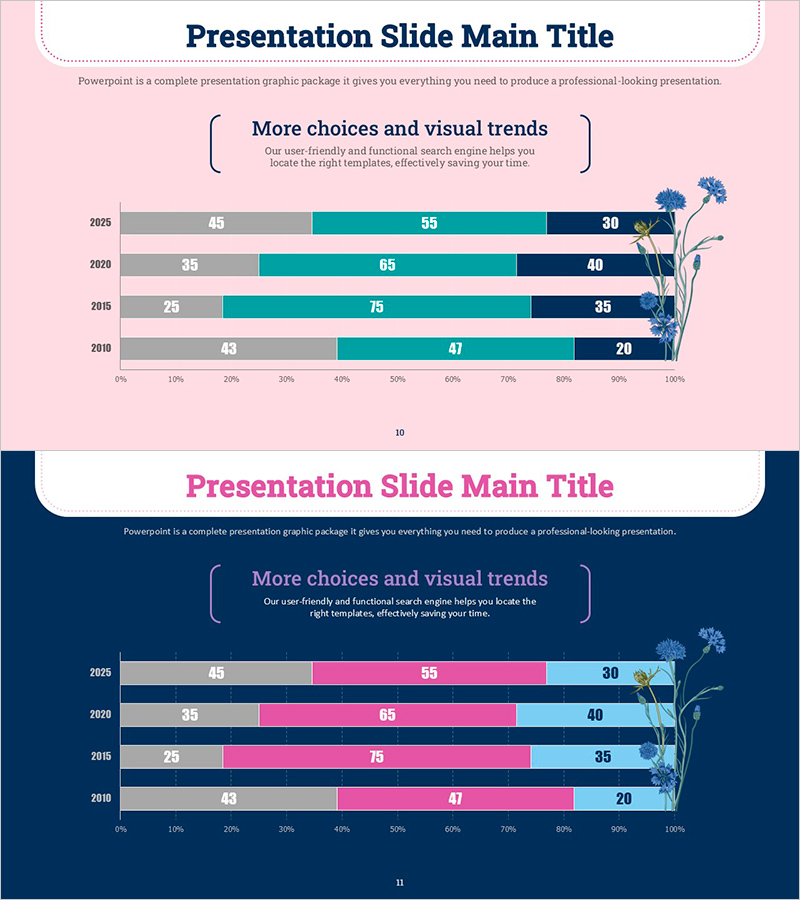
A PowerPoint slide featuring a horizontal bar chart visualizing market trends across four years (2010, 2015, 2020, 2025) with three data series differentiated by gray, teal, and navy blue colors. The chart uses a percentage-based horizontal axis (0–100%) enabling direct comparison of data values and ratio-based analysis. Each year displays three comparable items side by side, making it ideal for presenting market share evolution, customer preference shifts, and sales performance trends. Perfect for marketing plans, business reports, and competitive analysis presentations. Provided in 16:9 widescreen PPTX format with fully editable elements.
Usage Points
-
Main Usage
Displays numerical data across multiple years and categories using horizontal bars, enabling simultaneous size comparison and trend analysis. The percentage-based axis supports ratio-driven decision-making, while three distinct colors clarify category-specific performance evolution and market dynamics.
-
How to Use
Insert into marketing strategy presentations for competitive market share analysis, business reports for year-over-year performance review, and investor pitch decks for market size evolution. Double-click data values to edit directly; the chart updates automatically. Customize colors and labels to match your brand guidelines.
-
Recommended For
Marketing managers, business analysts, executives, and consultants preparing quarterly reports, annual performance reviews, market research presentations, and B2B sales pitches. Suitable for academic presentations, consulting proposals, and stakeholder briefings requiring multi-year data comparison.
-
Slide Structure
Slide 1: Title area + descriptive text + horizontal bar chart with four year rows (2010, 2015, 2020, 2025) and three data series per year + decorative floral illustration on right. Slide 2: Dark blue background version with identical layout. Each bar aligns to 0–100% axis with numeric labels displayed at bar endpoints.
Related Products
-

Eco-friendly Business Market Share Segmentation Horizontal Bar Chart
#Market and Competitor Analysis #Graph #Industry Trends
-

Navy-Orange 100% Stacked Chart
#Market and Competitor Analysis #Graph #Industry Trends
-

Horizontal Bar Chart for Changes in the Climbing Population – Market Trend Analysis
#Market and Competitor Analysis #Graph #Industry Trends
-

Paint Piano and Segmentation Bar Graph – Market Trend Analysis
#Market and Competitor Analysis #Graph #Market Analysis
