Market and Competitor Analysis
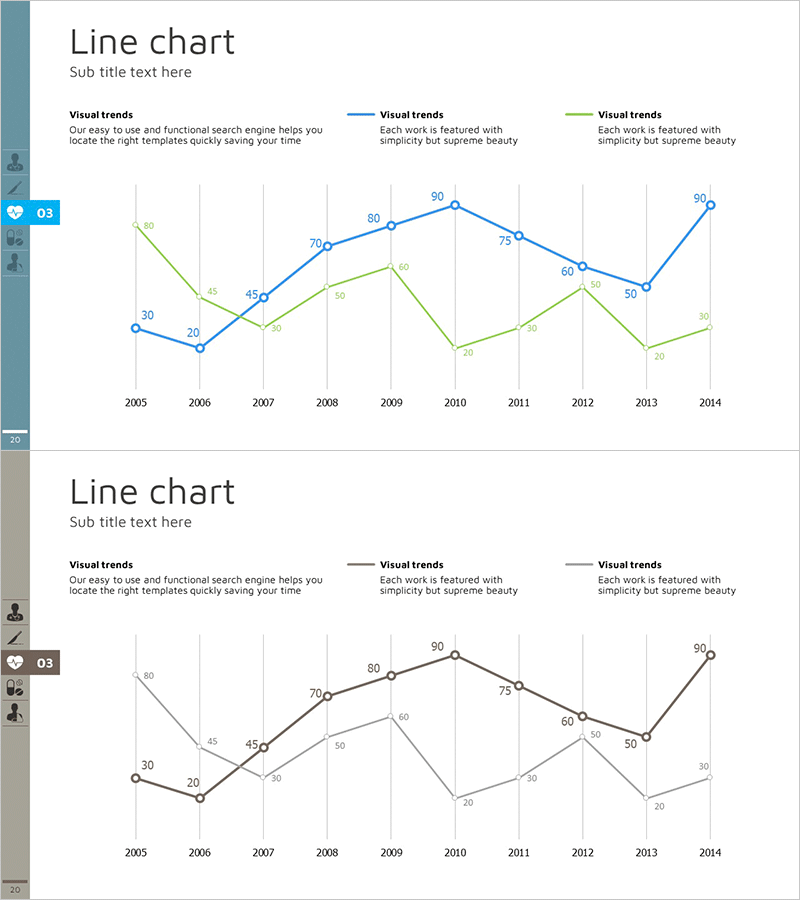
Competitor Analysis Broken Line Graph – Effective Visualization
RJ0400018_19
- Last Update 12/21/2025
- File Size 0.3MB
- # of Slides 2
- File Format PPTX
- Slide Ratio 16:9
- Color
Keywords
About the Product
This slide utilizes a broken line graph format for competitor analysis, visually comparing performance across different years. The blend of blue, brown, and teal colors offers a professional and clear view, allowing easy recognition of key data points. It is suitable for analyzing competitive situations and supporting strategic decision-making. The editing difficulty is rated as 'easy', allowing for simple replacement of various data values. Ideal users include marketing teams, management, and strategic planning departments.
Related Products
-
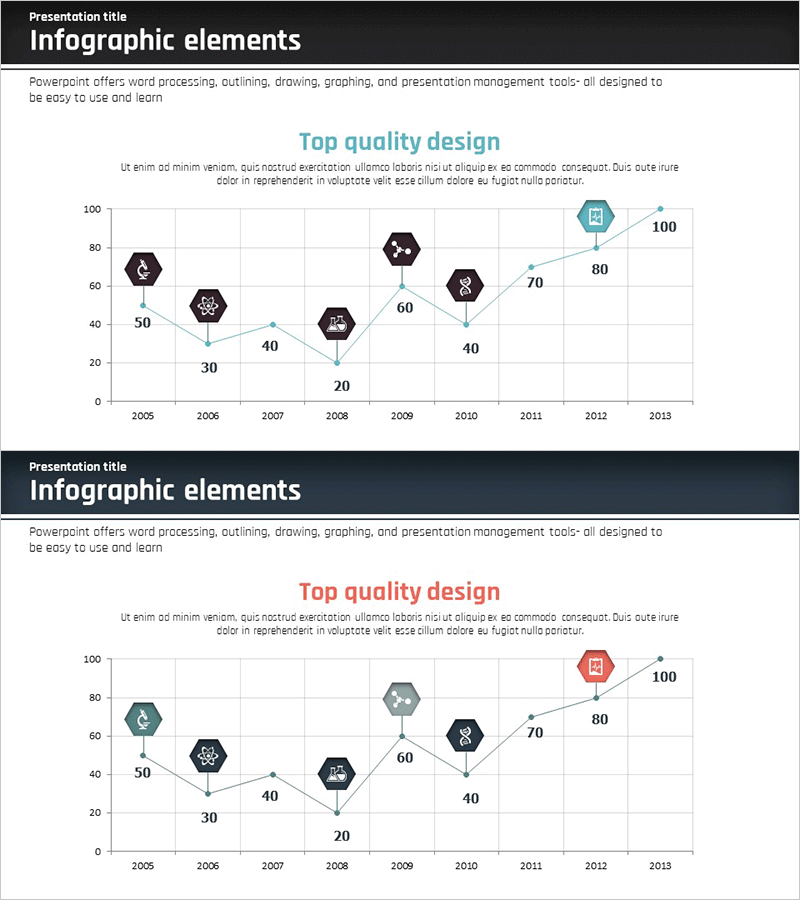
Market Trend Line Graph – Business Strategy
#Business Promotion Strategy #Market and Competitor Analysis #Graph
-
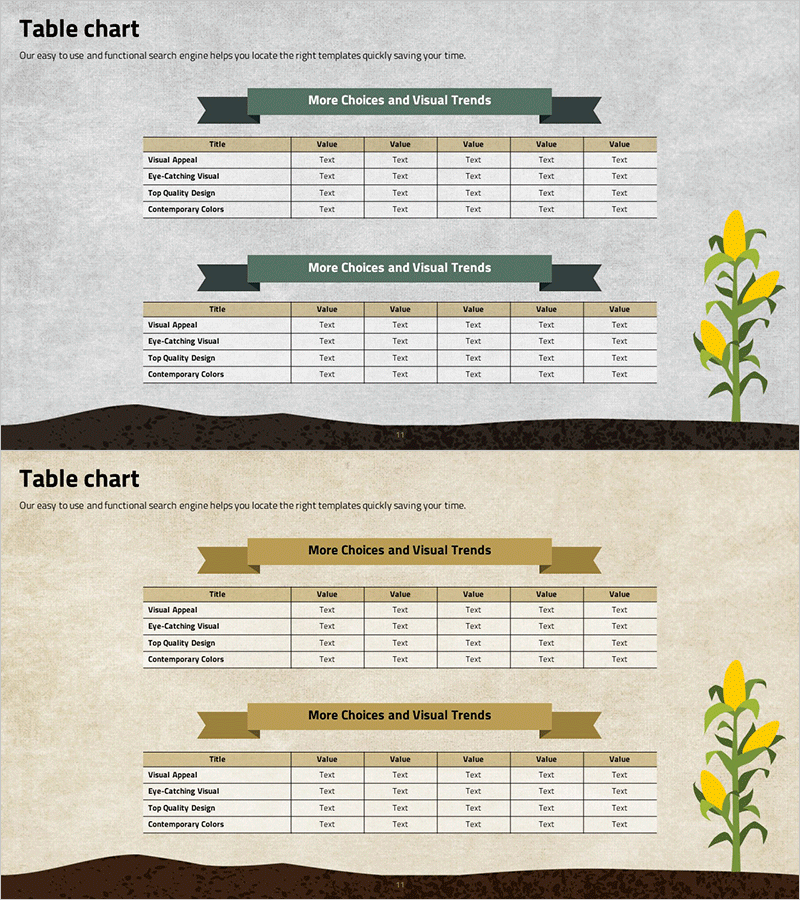
Corn Composition Analysis Table – Market Analysis and Financial Performance
#Market and Competitor Analysis #Financial Plans and Performance #Diagram
-
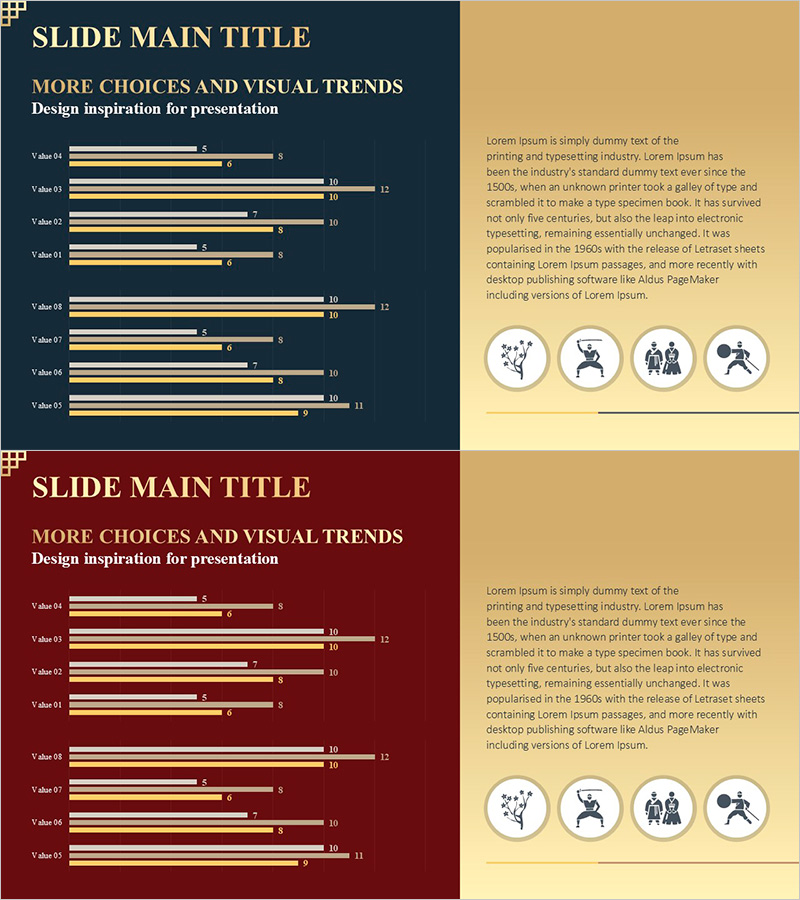
Analyzing the Gold Horizontal Bar Chart – Visualizing Business Insights
#Graph
-
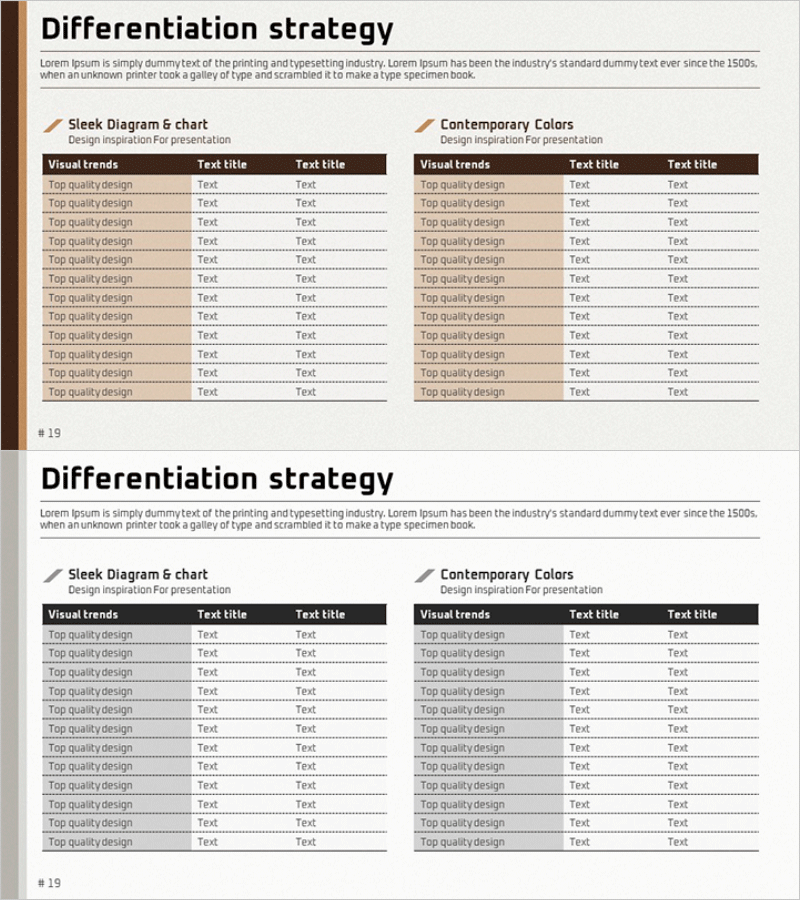
Business Differentiation Strategy Table – An Effective Tool for Market Competitiveness
#Business Vision and Strategy #Market and Competitor Analysis #Marketing Plan and Strategy
