Analyzing the Gold Horizontal Bar Chart – Visualizing Business Insights
RJ0800043_25
- Last Update 08/12/2025
- File Size 0.2MB
- # of Slides 2
- File Format PPTX
- Slide Ratio 16:9
- Color
Keywords
About the Product
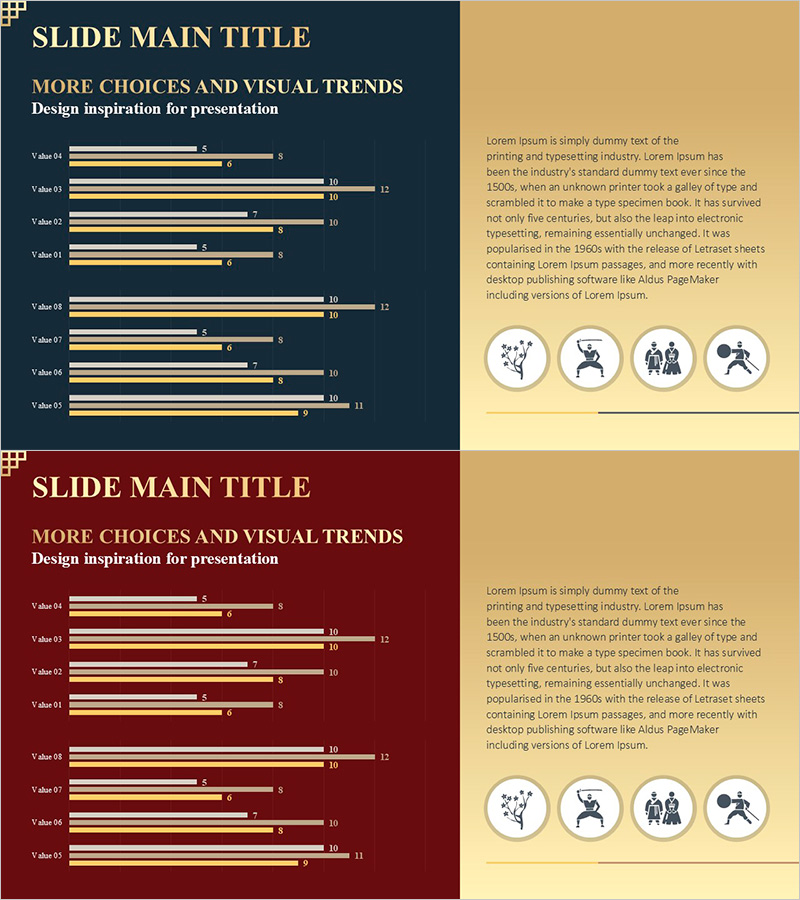
A horizontal bar chart PowerPoint slide optimized for business data analysis and performance comparison. This presentation template features two layout variations in gold and navy dual-tone colors, with each slide displaying 10 items for clear numerical comparison. Bar length intuitively conveys ranking and magnitude differences, while the right text area accommodates analytical commentary. Ready to use in business reports, performance presentations, and marketing decks for immediate data visualization.
Usage Points
-
Main Usage
Compares multiple data points such as sales figures, market share, performance metrics, and customer satisfaction ratings using horizontal bar representation. Bar length differences enable instant recognition of rankings and scale, making it ideal for executive briefings, quarterly performance reviews, and competitive analysis presentations.
-
How to Use
Adjust bar lengths to match actual data values and input numerical figures. Add analytical insights in the right text area. Choose between two color scheme options based on presentation theme. Customize the gold accent color to highlight key data points or corporate branding.
-
Recommended For
Finance teams presenting quarterly results, marketing teams comparing channel performance, sales teams reporting regional figures, and executives preparing strategic briefings. Suitable for any business presentation requiring clear quantitative data communication and comparative analysis.
-
Slide Structure
Two-slide set, each containing a 10-item horizontal bar chart. The left section displays gold and navy bars arranged horizontally, while the right section provides dedicated text space for analysis. Formatted in 16:9 widescreen ratio for modern presentation environments.
Related Products
-

Business Analysis Bilinear Bar Graph
#Market and Competitor Analysis #Graph #Competitor Analysis
-

Market Analysis Bundle Vertical Bar Graph – Effective Data Visualization
#Market and Competitor Analysis #Graph #Competitor Analysis
-

Market Demand Analysis PowerPoint Slide – Donut Chart Layout
#Market and Competitor Analysis #Graph #Customer Analysis
-

Competitor Comparison Analysis Graph - Optimized for Market and Competitor Analysis
#Market and Competitor Analysis #Graph #Competitor Analysis
