Business Differentiation Strategy Table – An Effective Tool for Market Competitiveness
RM0100001_18
- Last Update 01/24/2025
- File Size 2MB
- # of Slides 2
- File Format PPTX
- Slide Ratio 16:9
- Color
Keywords
- #Content-Based Slides
- #Design-Based Slides
- #Business Vision and Strategy
- #Market and Competitor Analysis
- #Marketing Plan and Strategy
- #Diagram
- #Business Strategy
- #Target Market Strategy
- #Table
- #16:9
- #differentiation strategy table PowerPoint
- #comparison analysis slide deck
- #competitive analysis table PPT
- #marketing strategy presentation template
- #business differentiation PowerPoint slide
About the Product
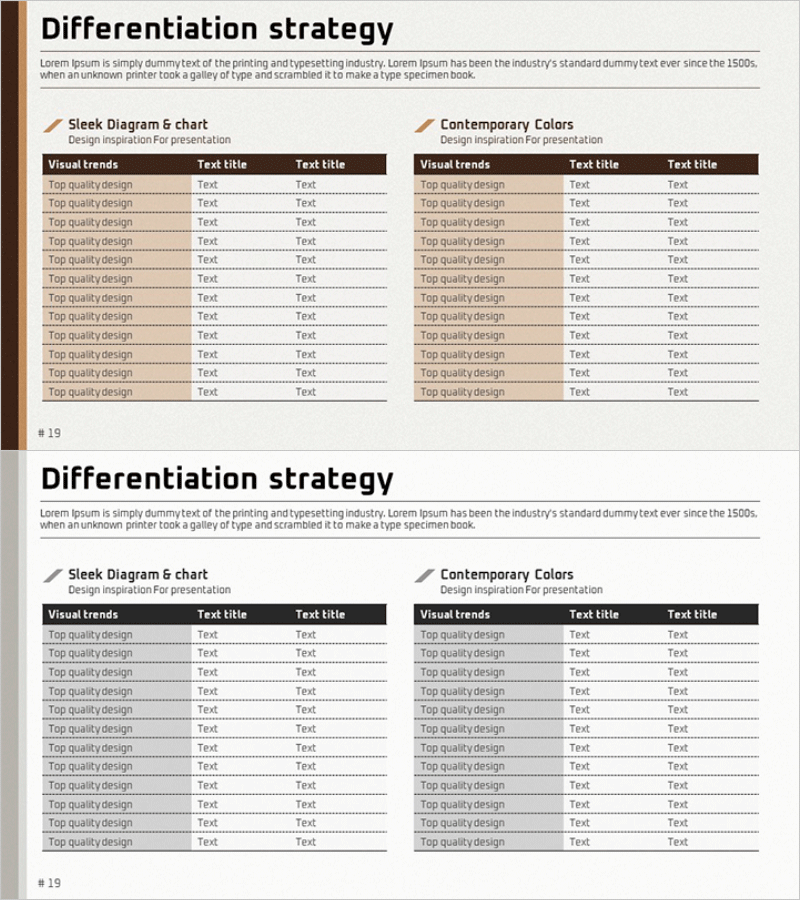
A 2-slide PowerPoint presentation that visualizes business differentiation strategies using a side-by-side comparison layout. Each slide presents two design options: 'Sleek Diagram & Chart' and 'Contemporary Colors,' featuring dual tables with three columns (Visual Trends, Text Title, Text Title) and multiple rows for data entry. The beige, brown, and black color palette creates a professional, minimal aesthetic suitable for competitive analysis and marketing strategy presentations. Delivered in 16:9 widescreen PPTX format with ample text input areas to clearly articulate your company's unique competitive advantages and market positioning.
Usage Points
-
Main Usage
Present your company's market differentiation strategy in a structured table format to executives, investors, and partners, clearly demonstrating competitive advantages. The dual-column layout enables simultaneous visualization of alternative differentiation approaches, strengthening decision-making rationale.
-
How to Use
Insert into the 'Market Analysis' or 'Competitive Strategy' section of business plans, investor pitch decks, or marketing proposals. Populate each cell with visual trends, key messages, and concrete examples to enhance audience comprehension and engagement.
-
Recommended For
Marketing managers, strategy planning teams, and executives analyzing competitor positioning or launching new products. Ideal for investor presentations, consulting reports, and enterprise-wide strategic planning sessions.
-
Slide Structure
Both slides follow identical structure: one title area plus left table (3 columns × 10 rows) and right table (3 columns × 10 rows). Each table begins with 'Visual Trends' header row followed by repeating 'Top Quality Design' rows, accommodating up to 20 comparison items per slide.
Related Products
-

Automobile Market Export Volume Visualization Slide – Market Analysis and Strategy
#Market and Competitor Analysis #Marketing Plan and Strategy #Diagram
-

European Target Region Analysis Table – Marketing Strategy Development
#Market and Competitor Analysis #Marketing Plan and Strategy #Diagram
-

European Target Market Analysis Table – Foundation for Marketing Strategy
#Market and Competitor Analysis #Marketing Plan and Strategy #Diagram
-

Insight Slide with Visual Charts for Trend Communication
#Market and Competitor Analysis #Marketing Plan and Strategy #Diagram
