Market and Competitor Analysis
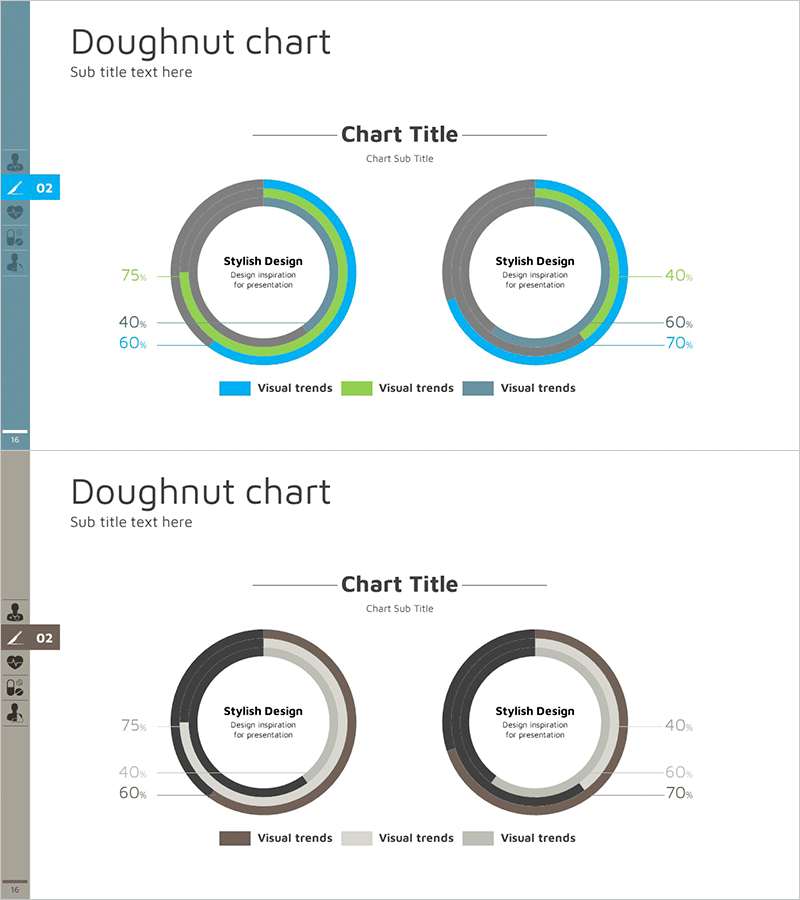
Market Share Analysis Donut Circle Graph – Strengthening Competitiveness
RJ0400018_15
- Last Update 12/21/2025
- File Size 0.3MB
- # of Slides 2
- File Format PPTX
- Slide Ratio 16:9
- Color
Keywords
About the Product
This slide features a donut circle graph designed to clearly visualize market share analysis results. With a clean design and intuitive data representation, it is highly useful for analyzing competitors or presenting market trends. The harmonious colors of blue, brown, and teal provide a visual stability, with clear emphasis on each data point. It is particularly suitable for conveying market research findings effectively, and the easy-to-edit structure makes it ideal for practitioners and strategic planners.
Related Products
-
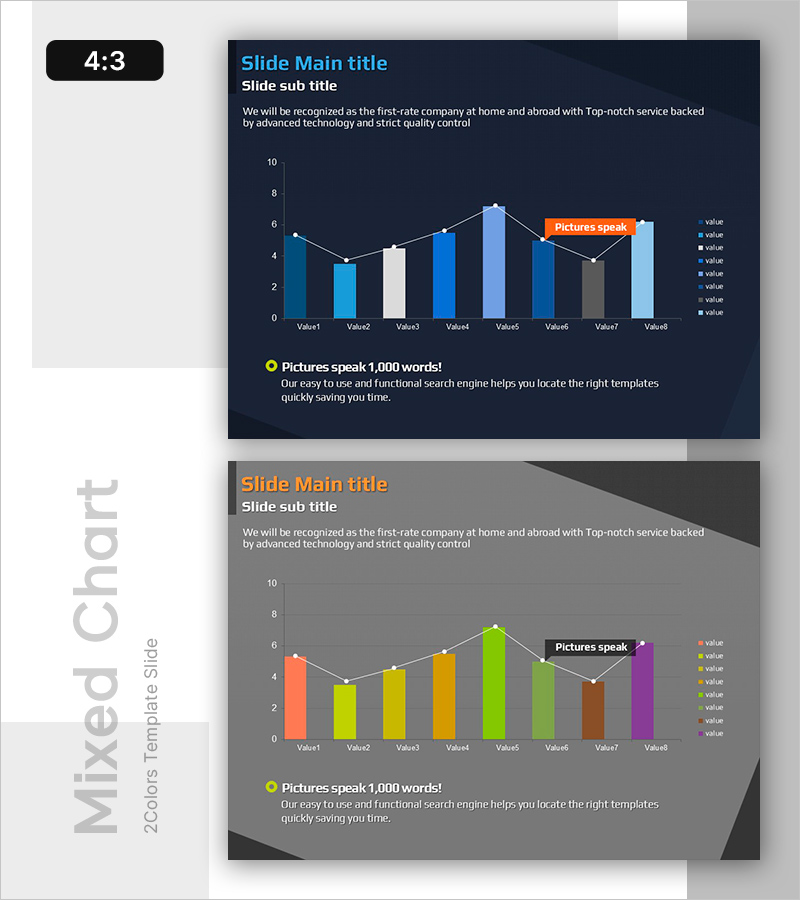
Mixed Bar Graph by Product – Visualization for Performance Maximization Strategy
#Business Promotion Strategy #Financial Plans and Performance #Graph
-
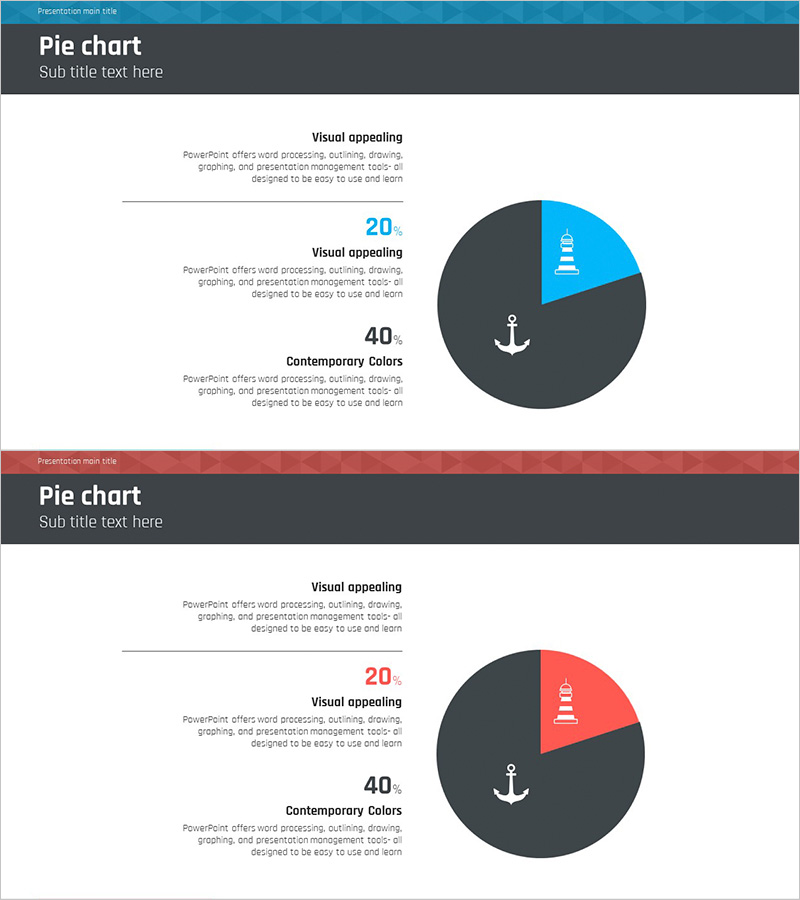
Sailing Travel Business Market Share Pie Chart Analysis
#Market and Competitor Analysis #Graph #Market Share
-
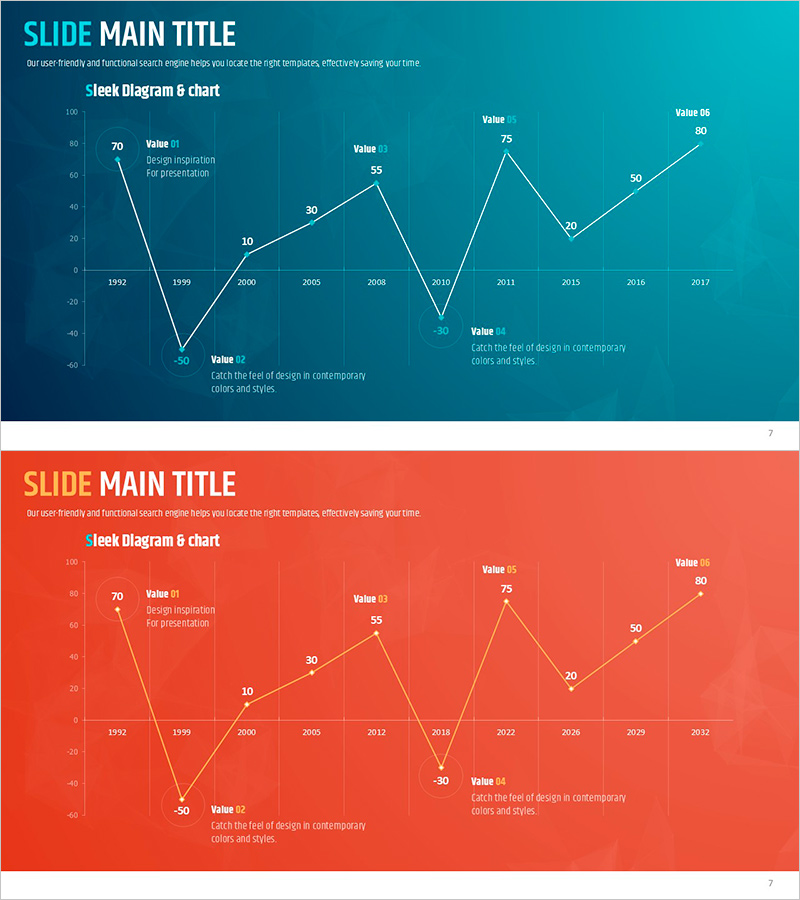
Graph of Sharp Drop in Sales – Scenarios of Loss and Recovery
#Financial Plans and Performance #Graph #Sales and Revenue
-
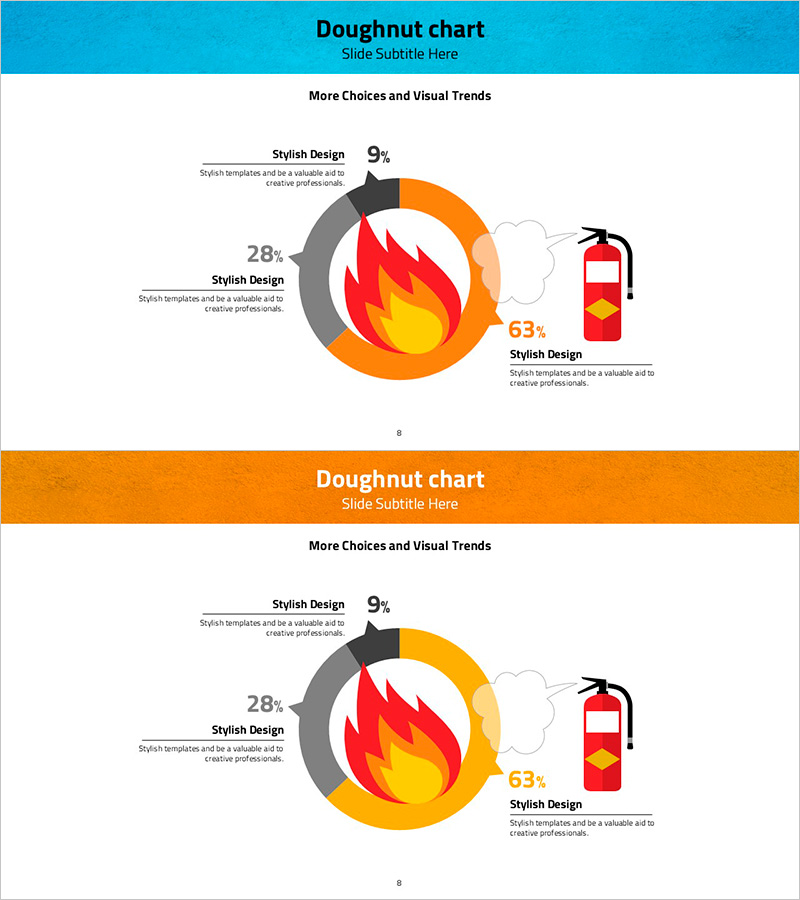
Causes of Fire Donut Chart – Visualizing Market Analysis
#Market and Competitor Analysis #Graph #Market Share
